
FIGURE 5.
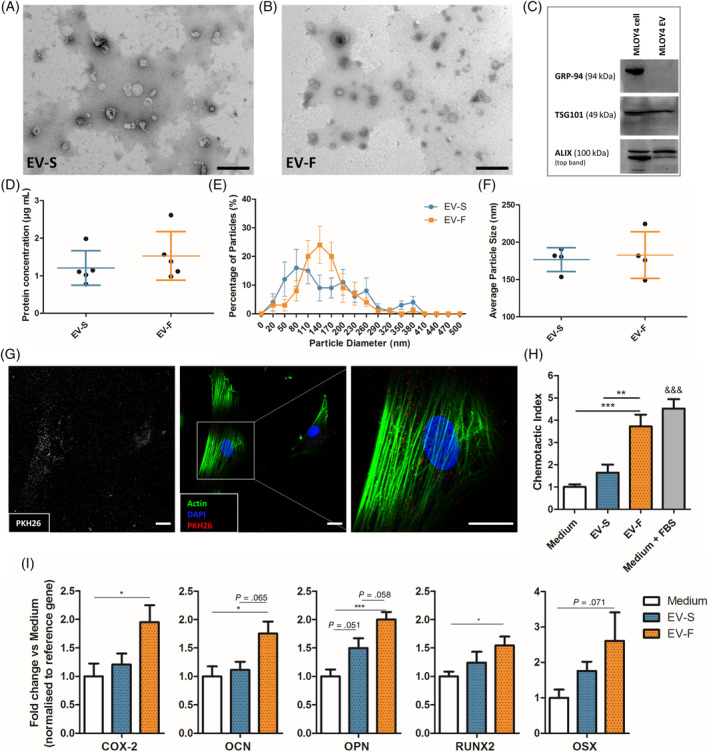
Characterization of EVs and their influence on hMSC osteogenesis. TEM image of EVs isolated from osteocyte CM‐S (A) and CM‐F (B). C, Immunoblots confirmed the presence of EVs via negative marker GRP‐94 and positive markers TSG101 and ALIX. D, Protein concentration of EVs in conditioned medium groups (n = 5). Nanoparticle size analysis on EVs confirmed no significant difference in distribution (E) or average size (F) between groups (n = 4). G, Immunofluorescent images illustrating osteocyte EV uptake by human bone marrow stem/stromal cell (hMSCs), as demonstrated by localization of PKH26 labeled EVs within the cell body (scale bar = 10 μm). H, Migration of hMSCs toward EVs isolated from osteocyte conditioned medium and normalized to Medium, showing significant increases in chemotactic index toward CM‐F medium when compared to CM‐S. I, Quantitative polymerase chain reaction (qPCR) analysis of COX‐2, OCN, OPN, RUNX2, and OSX expression in hSSCs treated with EVs from osteocyte medium from CM‐S and CM‐F. Statistical analysis using one‐way analysis of variance (ANOVA) and Bonferroni's multiple comparison post‐test (*P < .05, **P < .01, ***P < .001, &&& P < .001 vs Medium and EV‐S). EVs, extracellular vesicles; TEM, transmission electron microscope