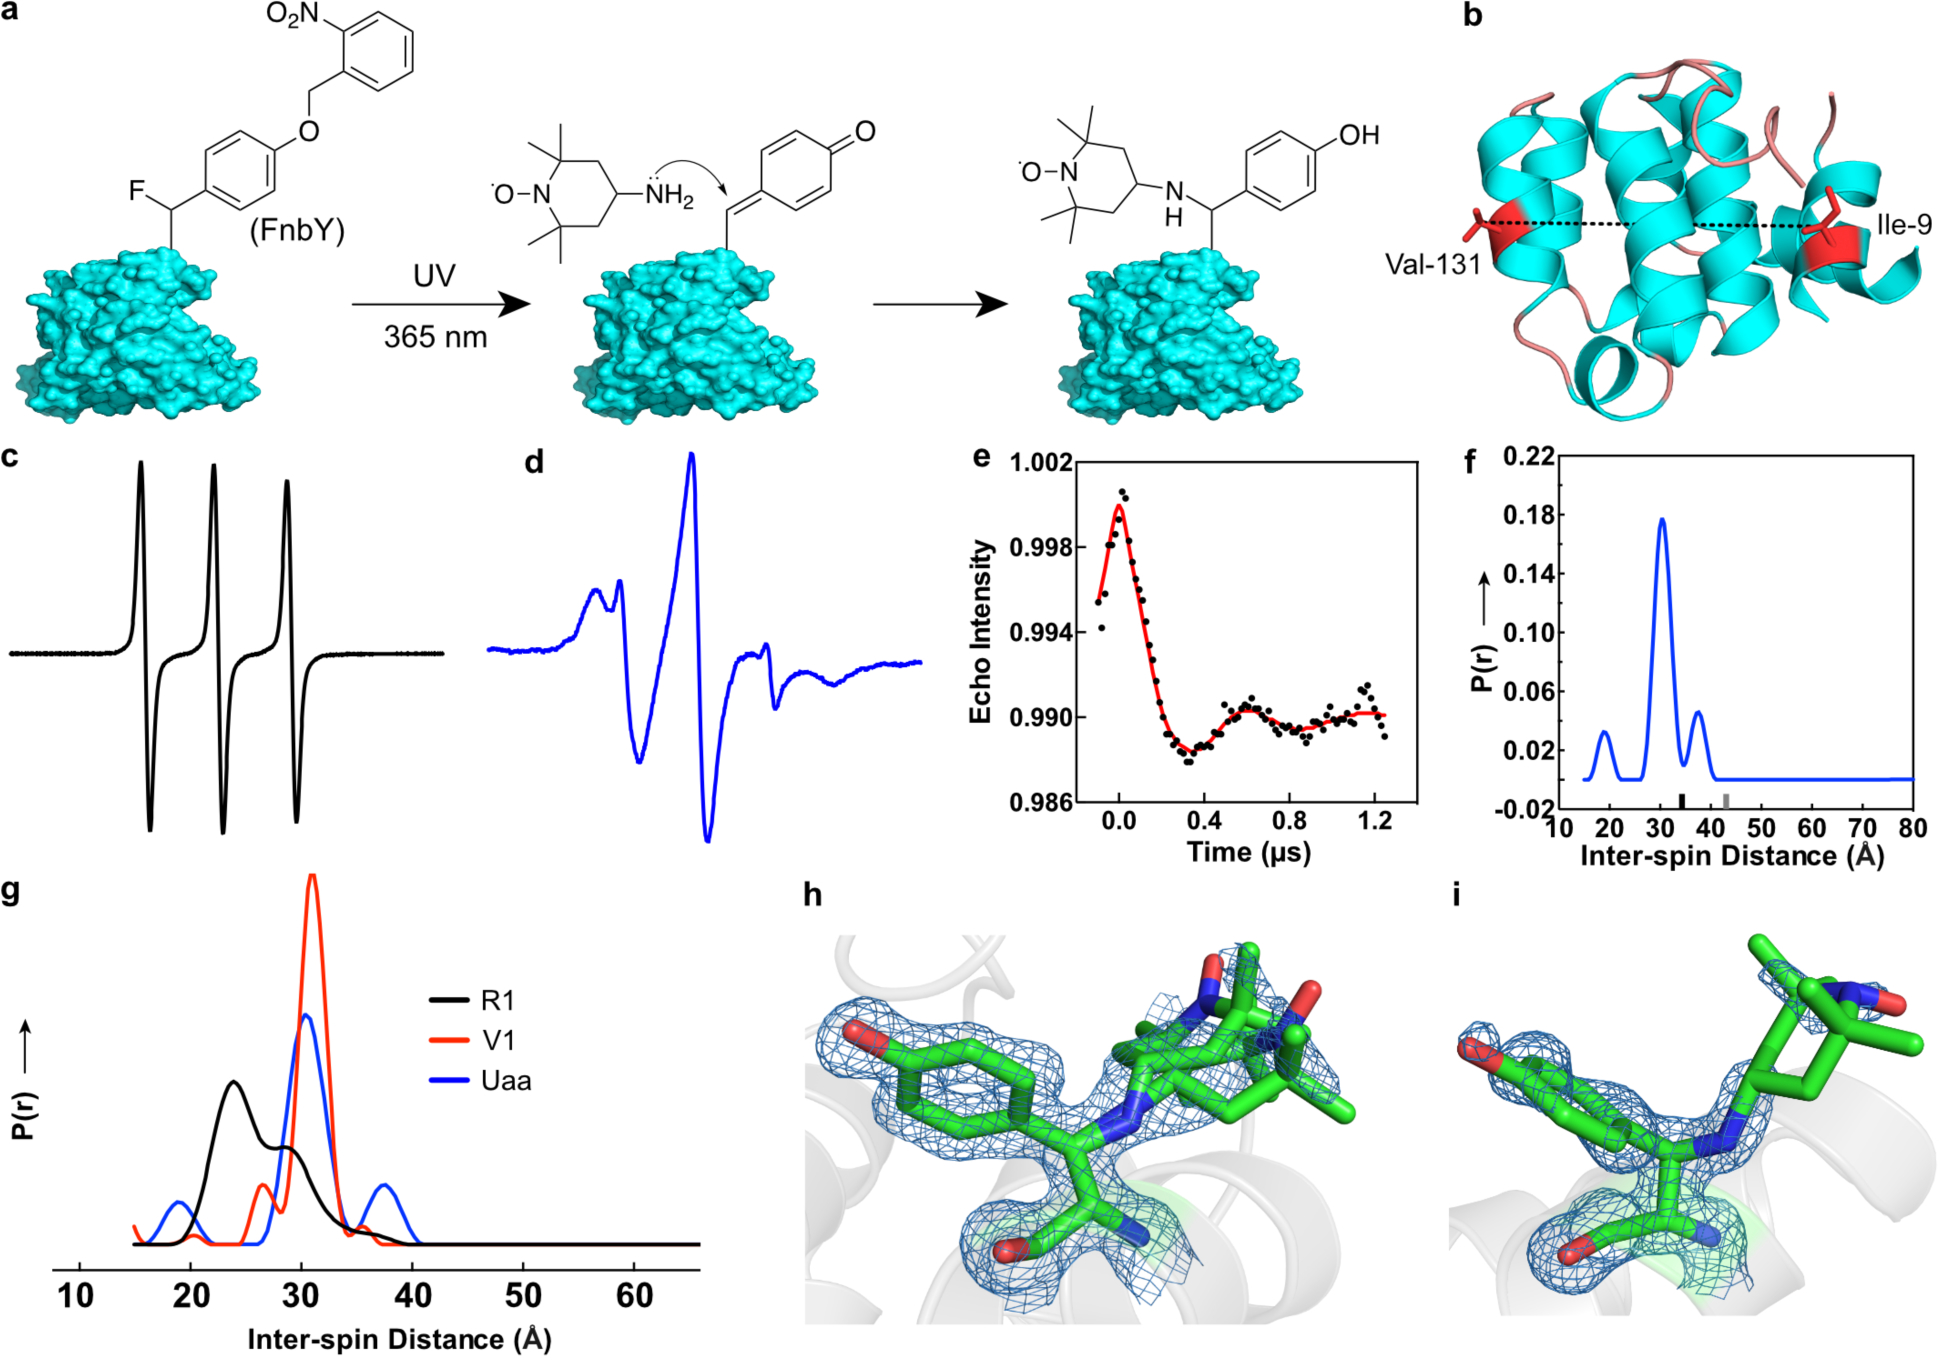
Fig. 6. Site-specific spin labeling via FnbY.

a, Scheme showing photo-controlled site specific labeling of 4-amine-TEMPO to proteins via FnbY. Note the labeling site is on the β-carbon. b, Ribbon diagram of T4 lysozyme (PDB 3LZM) showing sites Ile9 and Val131 for FnbY incorporation and spin labeling. Residues 12–67 of the structure are not shown for clarity. c, CW-EPR spectrum of 4-amine-TEMPO. d, CW-EPR spectrum of T4L with sites 9 and 131 both labeled with 4-amine-TEMPO through reacting with FnbY. e, Background corrected dipolar evolution function of the double spin labeled T4 lysozyme (black dotted trace) with a fit to the data shown in red. f, Derived interspin distance distribution of the double spin-labeled T4L (blue). The main peak in the distribution was fit with a gaussian function with a full width at half maximum (FWHM) of 3.9 Å. Ticks on the x-axis of the plot show the upper distance limits for reliability of peak shapes (black tick) and peak position (gray tick) as obtained by the program LongDistances (see methods). g, For comparison, distance distributions normalized to the area under the curves are shown for T4L containing spin label side chains R1 (black) or V1 (red) at positions 9 and 131 (data replotted from Ref. 47). h,i, 2Fo – Fc electron density map contoured at 1.0σ of spin-labeled FnbY-incorporated T4L at residue 9 and 131, respectively, as determined by x-ray crystallography. Two rotamers are modeled for position 9.
