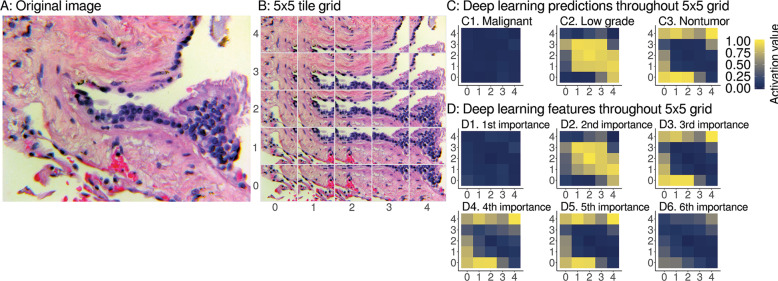
Fig. 5. Interpretable spatial distribution of deep learning predictions and features.
A An example image for deep learning prediction interpretation, specifically a pulmonary vein lined by enlarged hyperplastic cells, which we consider to be low-grade disease state. Case provided by YR. B The image is tiled into a 5 × 5 grid of overlapping 224 × 224 px image patches. For heatmaps, we use the same 5 × 5 grid as in Fig. 1C bottom left, imputing with the median of the four nearest neighbors for 4 of 25 grid tiles. C We show deep learning predictions for disease state of image patches. At left throughout the image, predictions have a weak activation value of 0 for malignant, so these patches are not predicted to be malignant. At middle the centermost patches have a strong activation value of 1, so these patches are predicted to be low grade. This spatial localization highlights the hyperplastic cells as low grade. At right the remaining normal tissue and background patches are predicted to be nontumor disease state. Due to our use of softmax, we note that the sum of malignant, low-grade, and nontumor prediction activation values for a patch equals 1, like probabilities sum to 1, but our predictions are not Gaussian-distributed probabilities. D We apply the same heatmap approach to interpret our ResNet-50 deep features as well. D1 the most important deep feature corresponds to the majority class prediction, i.e., C1, malignant. D2 The second most important deep feature corresponds to prediction of the second most abundant class, i.e., C2, low grade. D3 The third most important deep feature corresponds to prediction of the third most abundant class, i.e., C3, nontumor. The fourth (D4) and fifth (D5) most important features also correspond to nontumor. D6 The sixth most important deep feature does not have a clear correspondence when we interpret the deep learning for this case and other cases (Fig. S11), so we stop interpretation here. As expected, we did not find ImageNet2048 features to be interpretable from heatmaps, because these are not trained on histpathology (Fig. S11A5).

