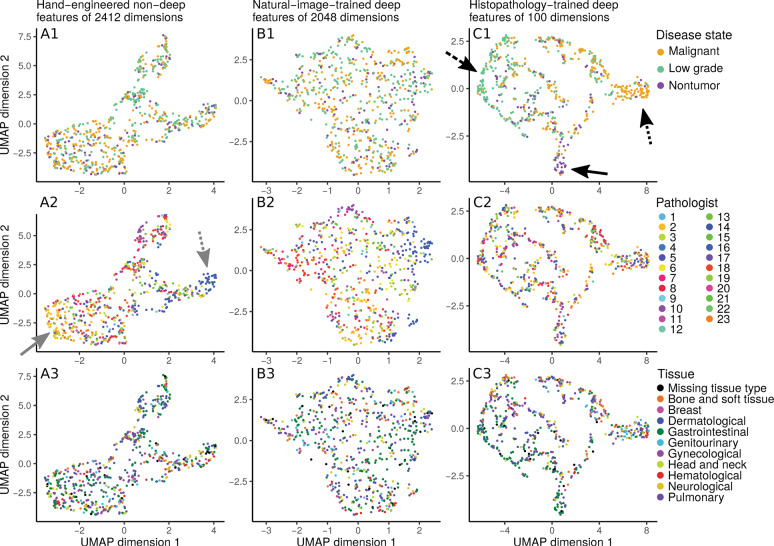
Fig. 6. Disease state clusters based on hand-engineered, natural-image-trained deep features, or histopathology-trained deep features.
To determine which features meaningfully group patients together, we apply the UMAP [34] clustering algorithm on a held-out set of 10% of our disease state data. Each dot represents an image from a patient case. In general, two dots close together means these two images have similar features. Columns indicate the features used for clustering: hand-engineered features (at left column), only-image-trained ImageNet2048 deep features (at middle column), or histopathology-trained deep features (at right column). Rows indicate how dots are colored: by disease state (at top row), by contributing pathologist (at middle row), or by tissue type (at bottom row). For hand-engineered features, regardless of whether patient cases are labeled by disease state (A1), pathologist (A2), or tissue type (A3), there is no strong clustering of like-labeled cases. Similarly, for only natural-image-trained ImageNet2048 deep features, there is no obvious clustering by disease state (B1), pathologist (B2), or tissue type (B3). However, for histopathology-trained deep features, patient cases cluster by disease state (C1), with separation of malignant (at dotted arrow), low grade (at dashed arrow), and nontumor (at solid arrow). There is no clear clustering by pathologist (C2) or tissue type (C3). The main text notes that hand-engineered features may vaguely group by pathologist (A2, pathologists 2 and 16 at solid and dotted arrows).

