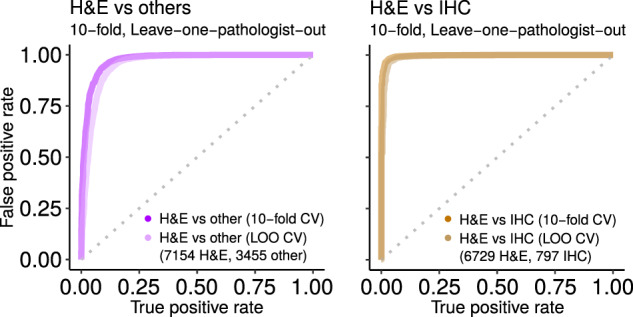
Fig. 7. H&E performance.

Predicting if an image is acceptable H&E human tissue or not (at left), or if image is H&E rather than IHC (at right). Ten replicates of ten-fold cross-validation (tenfold) and leave-one-pathologist-out cross-validation (LOO) had similarly strong performance. This suggests the classifier may generalize well to other datasets. We use the “H&E vs. others” classifier to find H&E images in PubMed. Shown replicate AUROC for H&E vs. others is 0.9735 for tenfold (ten replicates of tenfold has mean ± stdev of 0.9746 ± 0.0043) and 0.9549 for LOO (ten replicates 0.9547 ± 0.0002), while H&E vs. IHC is 0.9967 for tenfold (ten replicates 0.9977 ± 0.0017) and 0.9907 for LOO (ten replicates 0.9954 ± 0.0004). For this and other figures, we show the first replicate.
