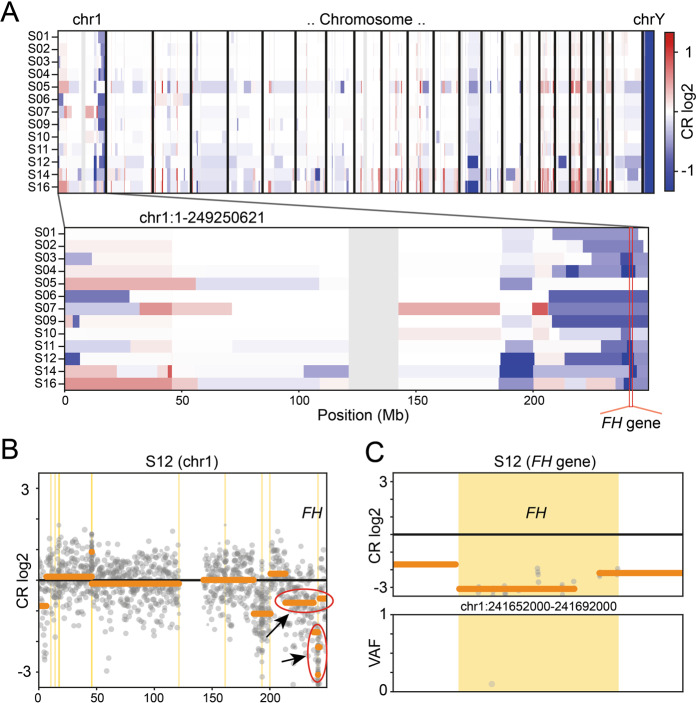
Fig. 2. Somatic copy number aberrations.
a Heat-plot of copy number (CN) aberrations detected in the 13 analyzed ULs using panel data. Upper panel: all chromosomes. Lower panel: zoomed in chromosome 1 containing the FH gene. Blue: CN loss, red: CN gain, CR: copy ratio. The position of the FH gene is indicated by the red stroke in the lower panel. Note the dark blue squares at the locus indicating samples with biallelic CN-loss in the tumor. In contrast to the relatively stable situation for SNVs/indels, all ULs show several larger CNVs with different recurrently affected genomic loci. When comparing the CNV-spectrum of the FH deficient ULs to 15 in-house HBOC tumors and correcting for multiple testing, only the FH-gene remained significant for CN-losses and the ALK-gene for CN-gains (see also Figure S4). Note that the 15.9 kb small deletion on one allele of sample S05 is merely identifiable at this resolution (compare Figure S5 CR-profile of this sample at the FH-gene locus). b Exemplary CR profile for sample S12 at chromosome 1 showing different rearrangements and especially the FH-gene locus affected by both a larger CN-loss and a second smaller one (marked by red ellipses and black arrows). c Zoomed in CR profile for sample S12 at the FH-gene locus with VAF (variant allele frequency) plot (lower panel). Gray dots represent markers used by CNVkit [40] (target and anti-target regions) and shading the dots indicates weight within the analysis. Vertical yellow bars mark gene regions. Horizontal orange bars represent CN segmentation calls.

