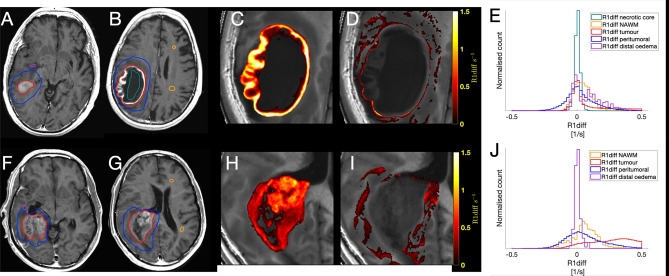
Figure 2.
Glioblastomas and the contrast enhancement depicted as R1-difference. Two typical examples of glioblastomas. (A,B) synT1WI GD of a tumour with contrast enhancement in the periphery and a necrotic center. (F,G) synT1WI GD of a tumour with a more solid tumour appearance, exhibiting irregular contrast enhancement throughout the tumour. (C,H) zoomed images of the R1–difference in the tumour ROI. (D,I) show the R1–difference for the peritumoral ROI. (E,J) The corresponding histograms for R1-difference of each ROI; orange line for the NAWM, blue for the peritumoral ROI, red for the tumour ROI, green for the necrotic centre, and purple for the distal oedema. The R1-difference equals the contrast enhancement.

