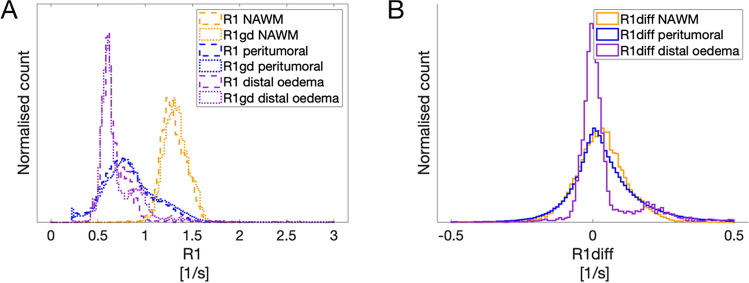
Figure 3.
Graphs of R1 and R1-difference in tumour and peritumoral area. The R1 and R1-difference histograms of all voxels for all patients within respective ROI. (A) the values for R1 preGD (dashed line) and postGD injection (dotted line) are depicted for the NAWM, tumour and peritumoral ROIs. The lines shift to the right after contrast agent injection. (B) shows the R1-difference (contrast enhancement) histogram for the peritumoral (blue) and the NAWM (black) ROIs for all patients. The R1-difference is significantly higher in the peritumoral area compared to NAWM (p = 0.048).

