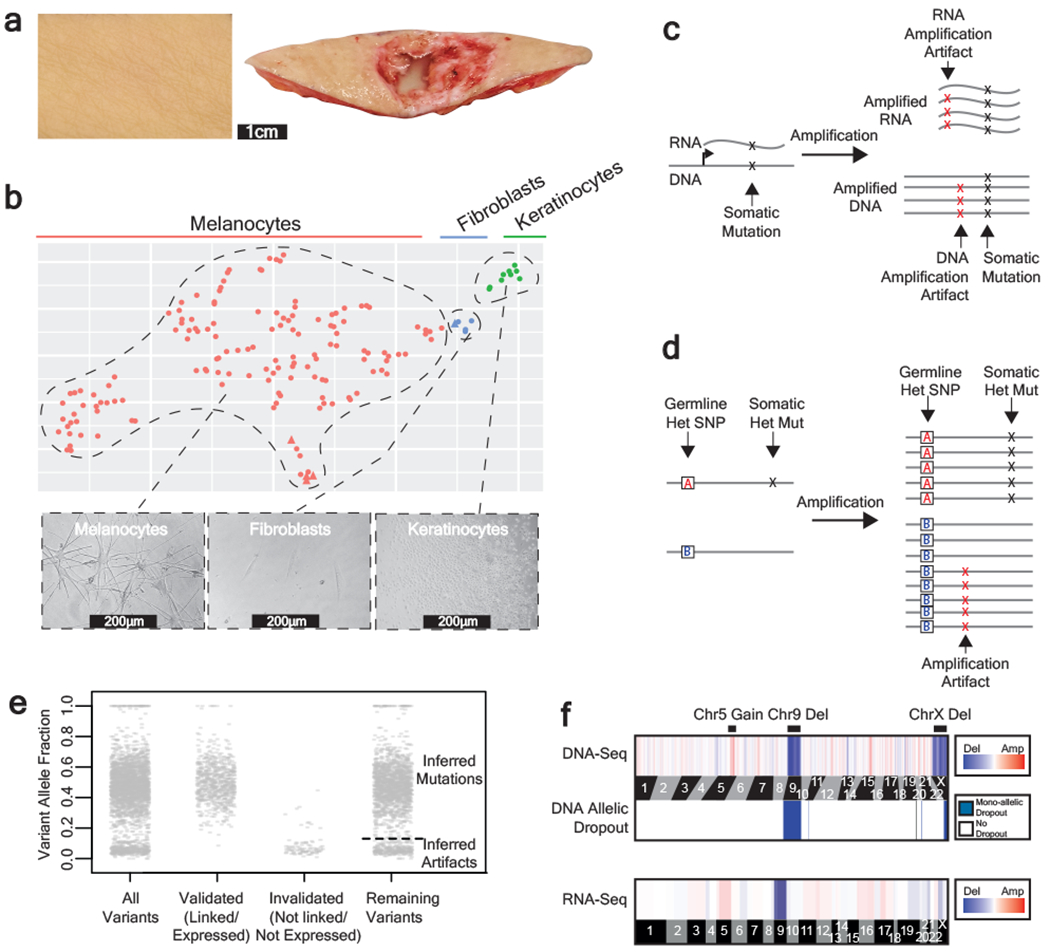
Figure 1 |. A workflow to genotype individual skin cells.

a, Examples of healthy skin from which we genotyped individual cells. Left panel: skin from the back of a cadaver. Right panel: skin surrounding a basal cell carcinoma. b, Expression profiles classify the cells that we genotyped into their respective lineages. Each cell is depicted in a t-SNE plot and colored by their morphology. A subset of 5 cells was engineered (see methods) and depicted as triangles. See Extended Data Fig. 1b–c for further details on cell identity. c-d, Patterns to distinguish true mutations from amplification artifacts. c, Mutations in expressed genes are evident in both DNA- and RNA- sequencing data, whereas amplification artifacts are not. d, Germline polymorphisms, distinguished here as “A” and “B” alleles, are in linkage with somatic mutations but not amplification artifacts. e, Variant allele fractions from an example cell indicate how we inferred the mutational status of variants outside of the expressed and phase-able portions of the genome. Variants that were validated as somatic mutations had variant allele fractions (VAFs) around 1 or 0.5, and variants that were invalidated had lower VAFs; however, PCR biases sometimes skewed these allele fractions. Variants that could not be directly validated or invalidated were inferred by their VAF (see methods for details). The dotted line indicates the optimal VAF cut-off to distinguish somatic mutations from amplification artifacts for this particular cell’s variants (see Extended Data Fig. 2b for more details). f, Copy number was inferred from DNA- and RNA- sequencing depth as well as from allelic imbalance -- an example of a cell with a gain over chr. 5q, loss of chr. 9, and loss of chr. X is shown.
