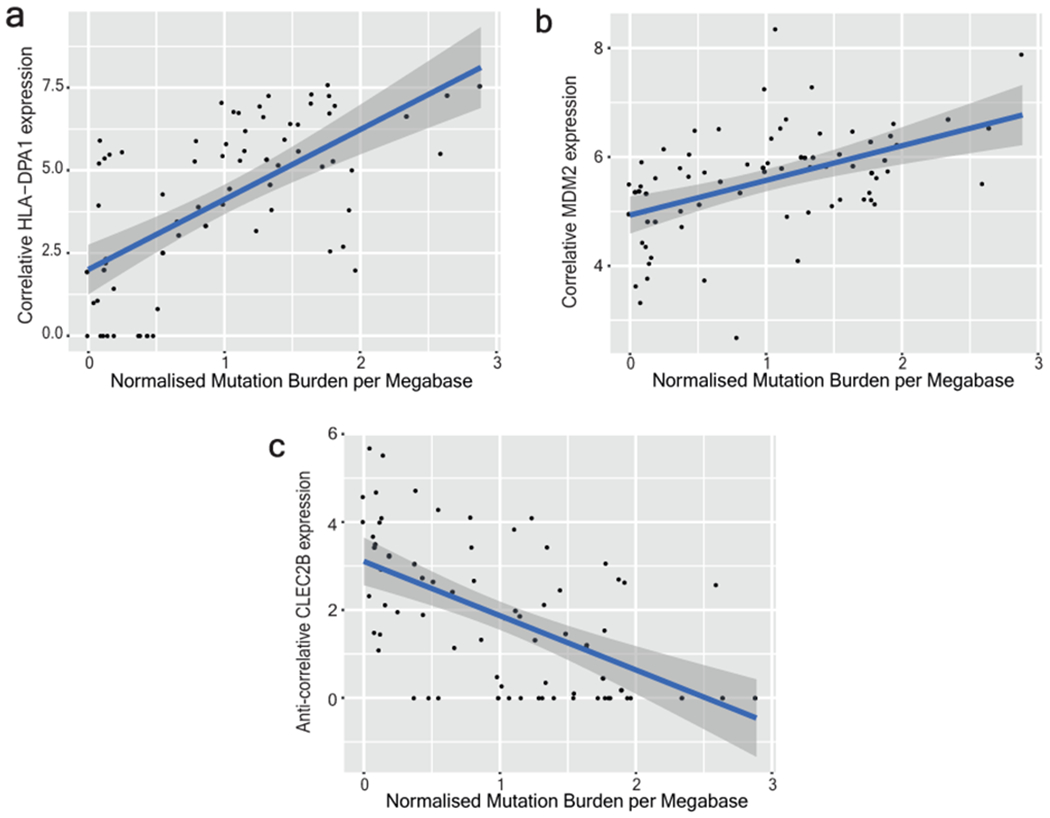
Extended Data Figure 5 |. Differential expression analysis revealing genes significantly correlating with mutation burden.

a-c, Gene expression versus normalised mutation burden is shown for two top correlative genes (HLA-DPA1 and MDM2) and one (CLEC2B) anti-correlative gene of interest from Supplementary Table 4. Clones included in this analysis are from anatomic sites with greater than 3 standard deviations of mutation burdens among their cells, thus demonstrating a range of mutation burdens. The plotted blue line represents a linear model fit to the data with 95% confidence intervals for that model prediction shown in grey.
