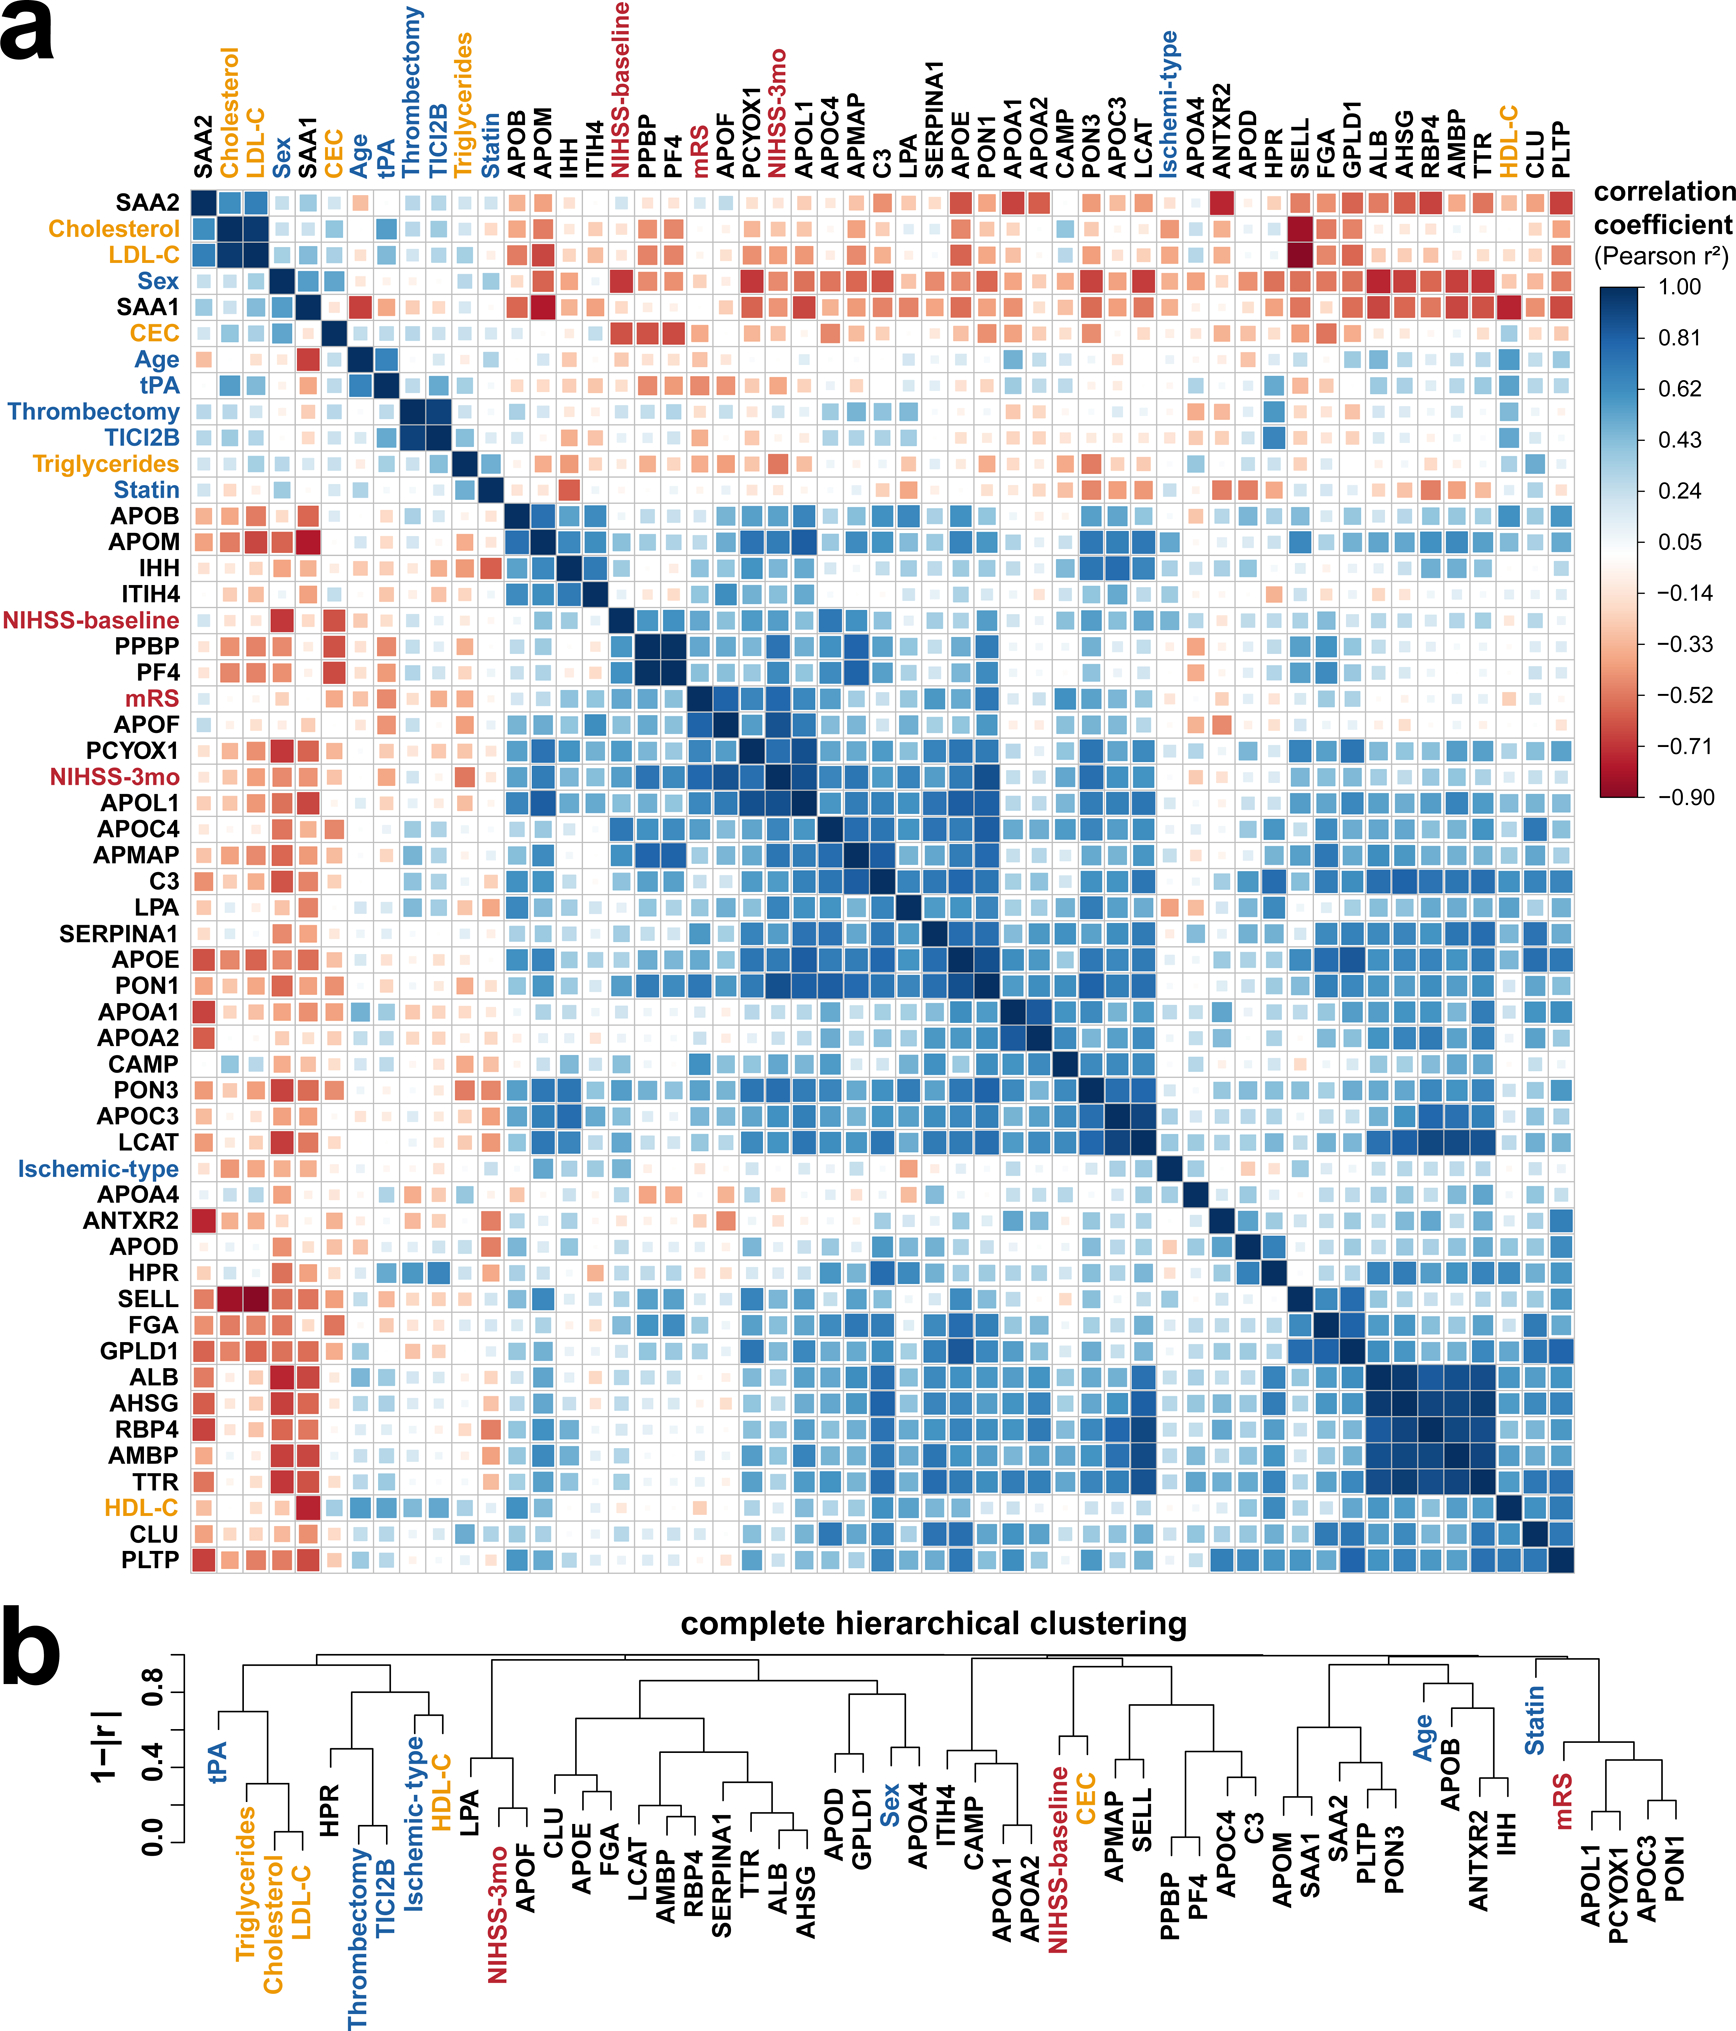
Figure 4. Relationship between stroke related patient metrics, HDL proteome, and function.

(a). Pearson correlations (positive in blue, negative in red) and (b) hierarchical clustering show stroke severity and recovery scores (in red) associating with HDL protein changes (black) more strongly than with other patient covariates (blue) or plasma lipid levels (gold).
