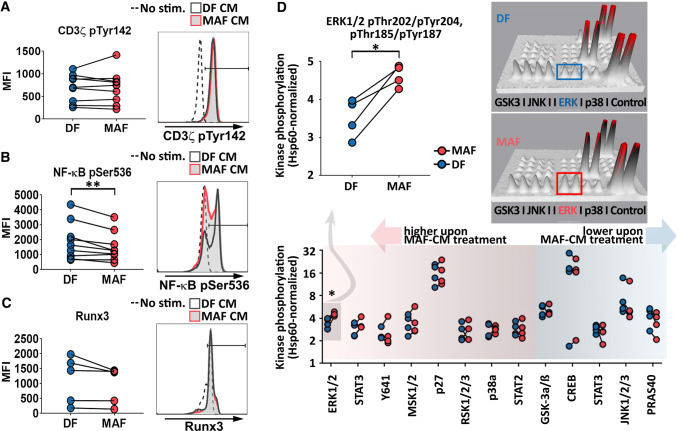
Fig. 3.
MAF-CM modulates CTL phosphorylation cascades downstream of TCR. a Analysis of CD3ζ-chain activation (n = 9). b NF-κB activation (n = 9) and c Runx3 levels (n = 5) in unstimulated, and DF-CM- or MAF-CM-exposed CD8+ T cells upon activation by aCD3/28. CD3ζ-chain and NF-κB phosphorylation were assessed 10 min post activation; Runx3 levels 48 h post activation. Representative data are shown to the right (Ratio paired t test p = 0.0093 for NF-κB; results from two independent experiments). d Screening analysis of 43 additional phosphorylated kinases in DF- and MAF-CM-treated CD8+ T cells using a phosphokinase array (n = 4). Shown are phosphorylation patterns of thirteen typical CD8+ T cell signaling proteins detected by the array 10 min post T cell activation (bottom). ERK1/2 phosphorylation data are shown magnified (top left, paired t test p = 0.0147). Representative 3D densitometry data display differences in ERK1/2 activation are shown (top right). Each phosphorylated protein is represented by a pair of spikes; volume of spikes equals to intensity of protein phosphorylation. Results obtained from one experiment

