
Extended Data Fig. 2. Production profiles of colipterins from the E. coli Nissle1917 culture.
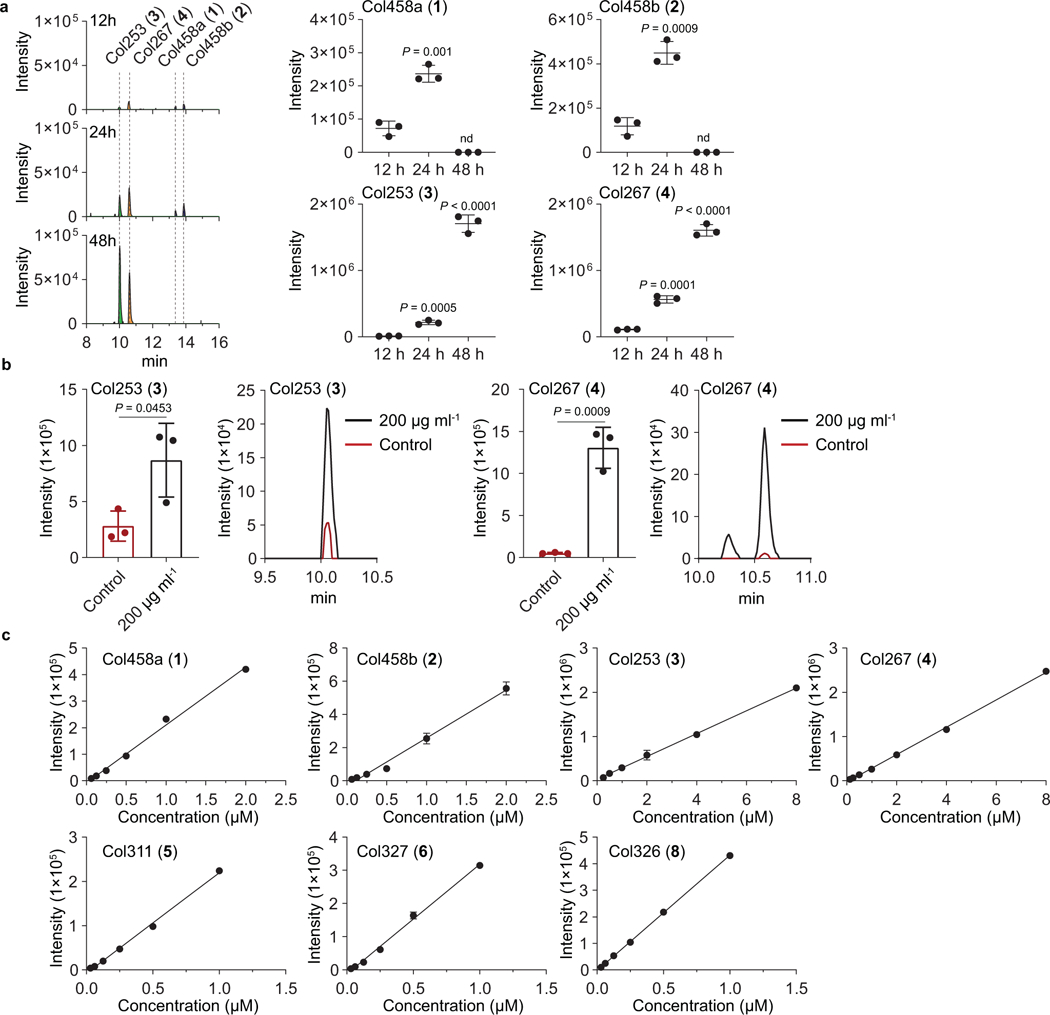
a, Time-course analyses of major colipterins 1-4 from the E. coli Nissle1917 culture. Peaks were extracted using the EIC method corresponding to the m/z of 1-4 within a 10 ppm window The mean and s.d. (error bars) from three biological experiments (n = 3) are shown. Statistical significance (two-tailed unpaired t-test) is compared to 12 h; nd, not detected. b, Detection of col253 (3) and col267 (4) from the cell pellet extracts. SMX was supplemented into E. coli cultures with a sub-lethal concentration of 200 μg ml−1. Representative data from 24 h cultures are given from three biological replicates (n = 3). The mean and s.d. (error bars) are presented. A two-tailed unpaired t-test was used to calculate P values. Concentrations of 3 and 4 in cell pellet extracts without (and with SMX 200 μg ml−1) drug stress are as follows: 3, ~ 0.7 (~ 4.0) μM; 4, ~ 0.3 (~ 4.8) μM. c, Calibration curves for the colipterin quantification. Concentrations of 1-8 in culture without (and with SMX 400 μg ml−1) drug stress are as follows: 1, ~ 0.2 (~ 1.0) μM; 2, ~ 0.3 (~ 1.5) μM; 3, ~ 2.0 (~ 7.1) μM; 4, ~ 1.3 (~ 5.3) μM; 5, ~ 0.06 (~ 0.2) μM; 6, nd (~ 0.6) μM; 8, ~ 0.07 (~ 0.2) μM. 7 oxidized to 8 in the methanol solution during the acquisition of Q-TOF-MS experiments. Data are shown as the mean ± s.d., n=3 from 3 technical triplicates