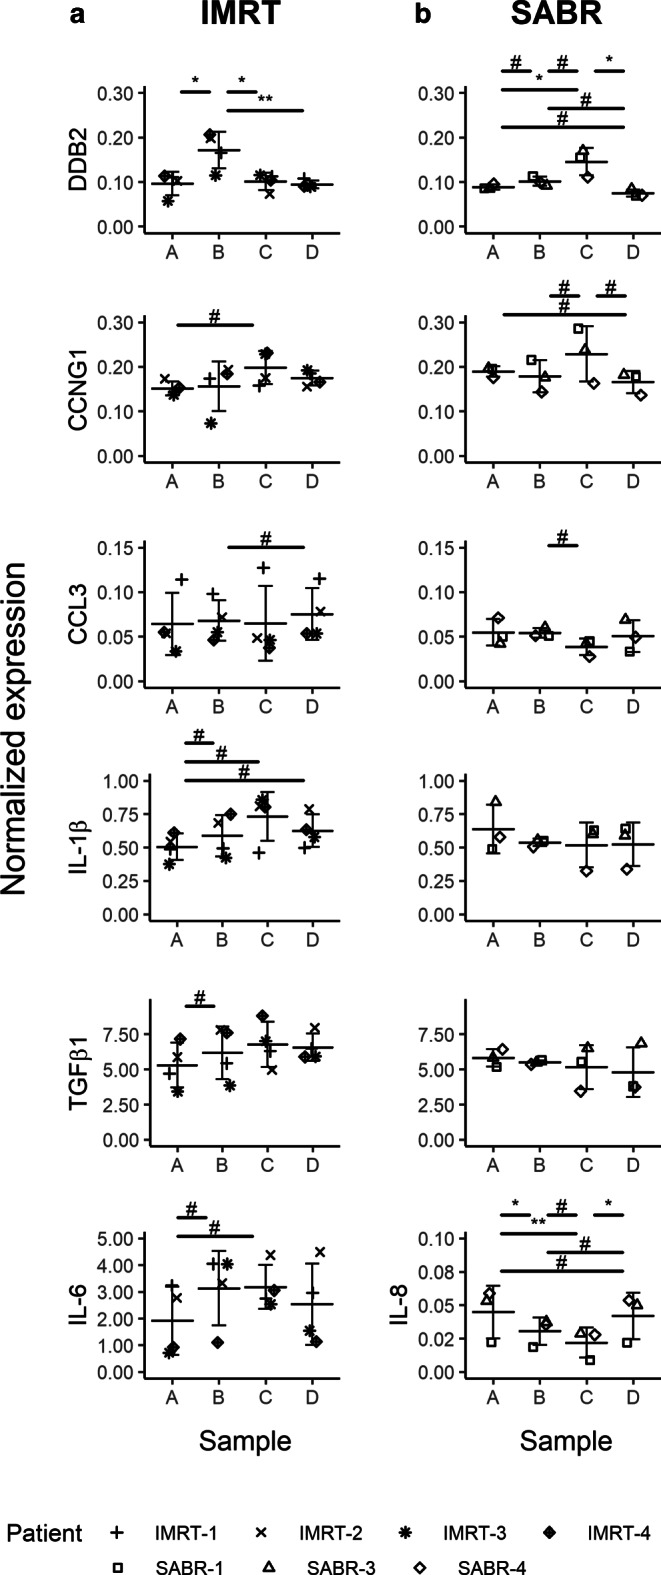
Fig. 3.

Gene expression of CCNG1, DDB2, CCL3, IL1B, TGFB1, and IL6 or IL8 in blood of the prostate adenocarcinoma patients treated with IMRT (a) and SABR (b). Blood was collected before the start of the treatment (blood collection point A), after 5 fractions for the IMRT group and after the first for the SABR group (blood collection point B), after the last fraction (blood collection point C), and 1 month after the last fraction (blood collection point D). Data are shown as individual datapoints together with the mean ± SD. Significant p-values for Tukey honest significant difference (HSD) test: asterisk for p < 0.05 and double asterisk for p < 0.01; hash indicates a very large effect size (|d| ≥ 1.2). All comparisons found significant by the Tukey HSD test also show large or very large effect size, which is not shown on the graph for reasons of clarity
