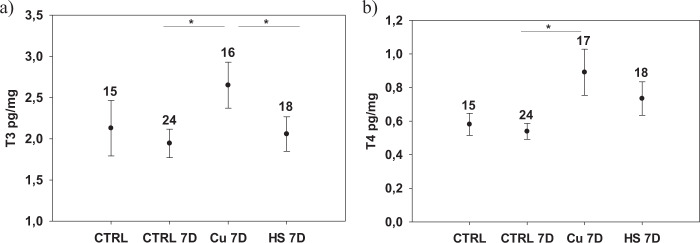
Fig. 3.
Intraovarian T3 (a) and T4 (b) concentrations (pg/mg, mean ± SEs) in three-spined sticklebacks experimentally exposed to copper (100 µg/L, CU 7D), warm temperature (10 °C increase, HS 7D) for 7 days and respective controls (CTRL 7D and CTRL – sampled before start of the experiment). Numbers above the bars refer to sample sizes. Stars represent significant differences between treatments at p < 0.05. For the statistical analyses the populations were pooled

