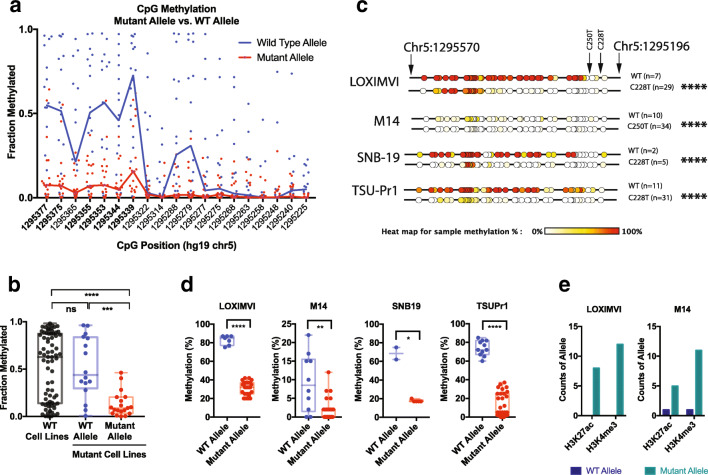
Fig. 2.
Allele-specific methylation in cancer cells with recurrent mutations in the TERT promoter region. Sequenced alleles were phased to assess CpG methylation patterns upstream of the recurrent promoter mutations C228T and C250T. a Scatter distribution plot of mutant and WT alleles showing allele-specific hypermethylation of the WT allele and reduced methylation of the mutant allele in a region upstream of the mutations, particularly at 6 CpGs (positions bolded in plot). b Methylation of the 6 differentially methylated CpGs compared between WT and mutant alleles in cancer cells harboring TERT promoter mutations. Generally, mutant alleles were hypomethylated, while the WT alleles of mutant cell lines and alleles from WT cell lines were hypermethylated. c CpG methylation maps and d distribution plots from conventional bisulfite Sanger sequencing of cancer cell lines with TERT promoter mutations, LOX-IMVI, M14, SNB19 and TSU-PR1, validate bisulfite deep sequencing results, showing that WT alleles are hypermethylated and mutant alleles are hypomethylated. e ChIP of LOX-IMVI and M14 cells showing that mutant alleles are enriched with the open chromatin marks, H3K4me3 and H3K27ac. Mann-Whitney test was used to assess statistically significant differences in plots, while Chi-square test was used in a 2 × 2 contingency table of TERT promoter status of allele (WT vs mutant) and GpG methylation (methylated vs unmethylated). Asterisks denote level of significance (* p ≤ 0.5, ** p ≤ 0.01, *** p ≤ 0.001, **** p ≤ 0.0001)

