Fig. 4.
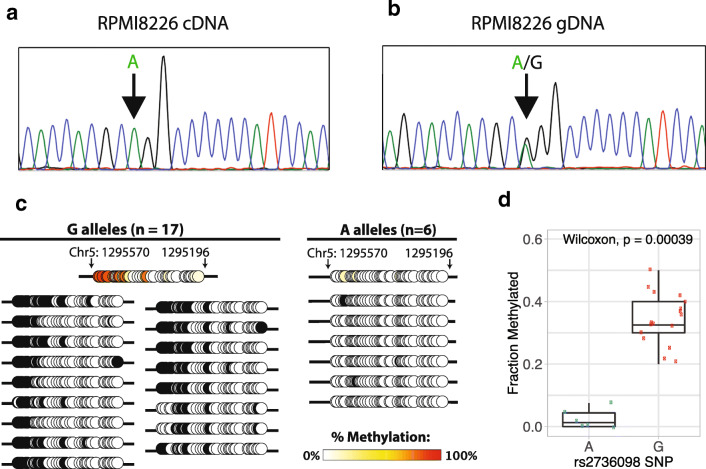
Hypermethylation of repressed allele and hypomethylation of active allele in the WT TERT promoter. Monoallelic expression of TERT in cell line RPMI8226 shows selective expression of the hypomethylated allele. Sanger sequencing of a cDNA and b gDNA in the rs2736098 locus revealed that RPMI8226 possessed both the A and G alleles, but expressed only the A allele. c CpG methylation maps from long-range bisulfite sequencing, showing only the region overlapping the highly recurrent C228T and C250T mutations in the TERT promoter region hg19 chr5: 1295196–1,295,570. The expressed A allele is unmethylated while the unexpressed G allele is methylated. Black circles indicate methylated CpGs and open circles indicate unmethylated CpGs. d Box plot including the median, 25% quantile, and 75% quantile of fraction methylated for A and G alleles. The whiskers show the 95% confidence interval for the median

