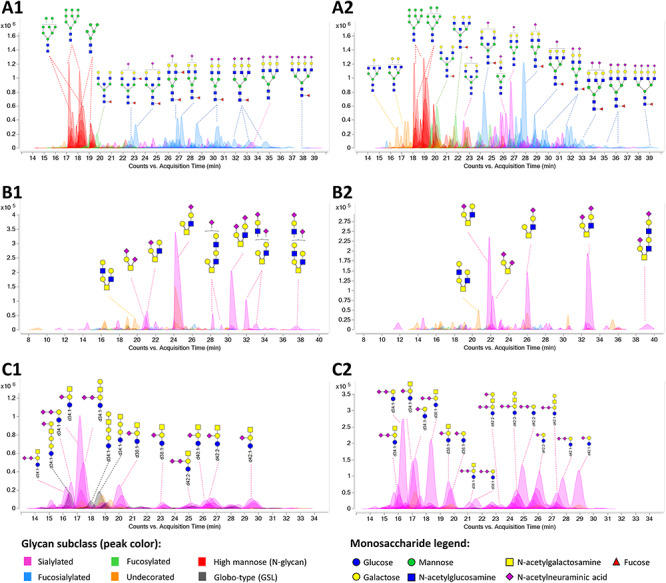
Fig. 1.

Extracted compound chromatograms of NTERA-2, showing (A) N-glycan, (B) O-glycan and (C) GSL profiles of (1) undifferentiated and (2) neural cells. Peaks are colored by glycan subtypes and annotated with the schematic representations of the glycan structures. The GSL ceramide portions are denoted by the number of hydroxyl groups (d or t for di- or tri-hydroxy), total length of lipid and the number of unsaturation. For example, d34:1 describes a ceramide with 2 hydroxyl groups, 34 total carbons and 1 unsaturation. Glycan structures were drawn with GlycoWorkbench (Ceroni et al. 2008). Monosaccharide symbols follow the Symbol Nomenclature for Glycans (SNFG) system (Varki et al. 2015).
