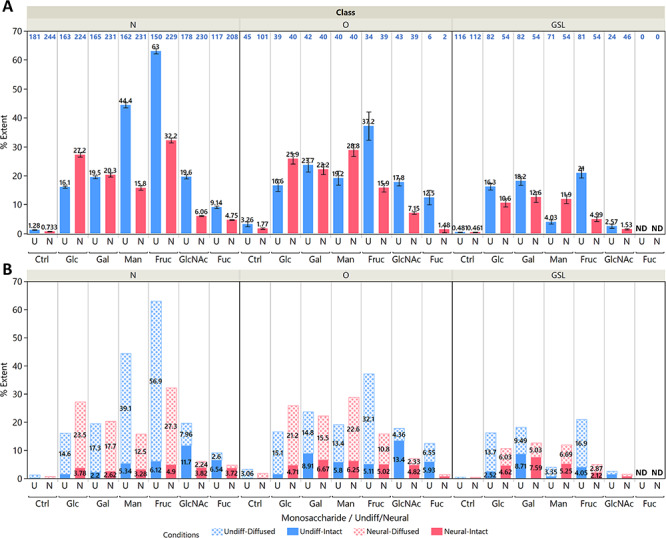
Fig. 3.

(A) Mean values for the extent of incorporation %E for N-glycans, O-glycans and glycosphingolipids in both undifferentiated (blue) and neural (red) cells. The cells were fed with 5 mM of the indicated labeled monosaccharide for 72 h except for fucose, which was given 100 μM. Error bars indicate standard errors for identified glycans, with the N shown in blue text above each bar plot. Note that the GlcNAc values include only glycans with GlcNAc, GalNAc and NeuAc, while fucose values include only fucosylated glycans because of the specificity of their incorporation. No fucosylated GSLs were detected. (B) Stacked bar plots showing the contribution of diffused incorporation %Ed (dotted pattern) and intact incorporation %Ei (solid pattern). Plots for individual glycan compositions are shown in Supplementary Figure S2.
