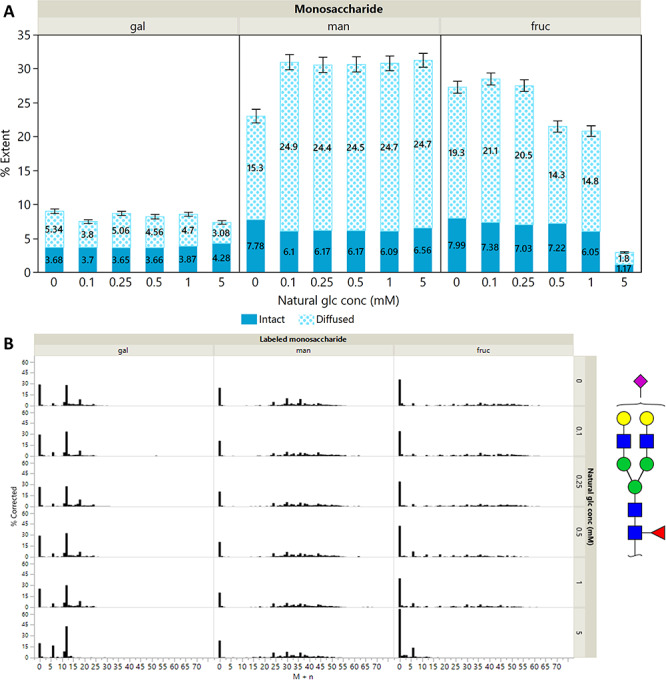
Fig. 4.

(A) Mean values for the extent of diffused incorporation %Ed and the extent of intact incorporation %Ei for N-glycans. Their sum represents the total extent of incorporation %E. Standard errors are shown for N ≈ 200 glycans. Plots for individual glycan compositions are shown in Supplementary Figure S3. (B) Isotopologue profiles for the bi-antennary complex N-glycan Hex5HexNAc4Fuc1NeuAc1 during co-feeding of 5 mM [13C-UL] galactose, mannose or fructose with normal glucose at concentrations of 0, 0.10, 0.25, 0.50, 1.00 and 5.00 mM. Monosaccharide symbols are as follows: mannose (green circle); galactose (yellow circle); N-acetylneuraminic acid (NeuAc, pink diamond); N-acetylglucosamine (GlcNAc, blue square); fucose (red triangle).
