Fig. 5.

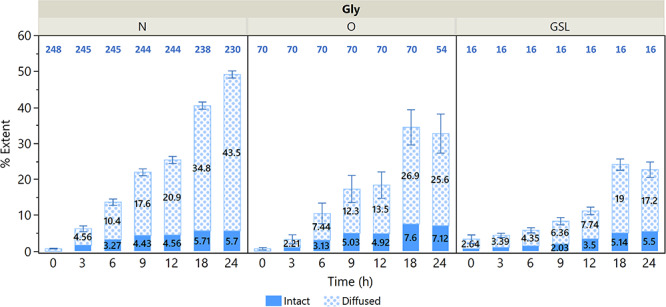
Mean values for the extent of diffused incorporation %Ed and the extent of intact incorporation %Ei for N-glycans, O-glycans and GSLs. Standard errors are shown for the number of glycans listed in blue above each bar plot.

Mean values for the extent of diffused incorporation %Ed and the extent of intact incorporation %Ei for N-glycans, O-glycans and GSLs. Standard errors are shown for the number of glycans listed in blue above each bar plot.