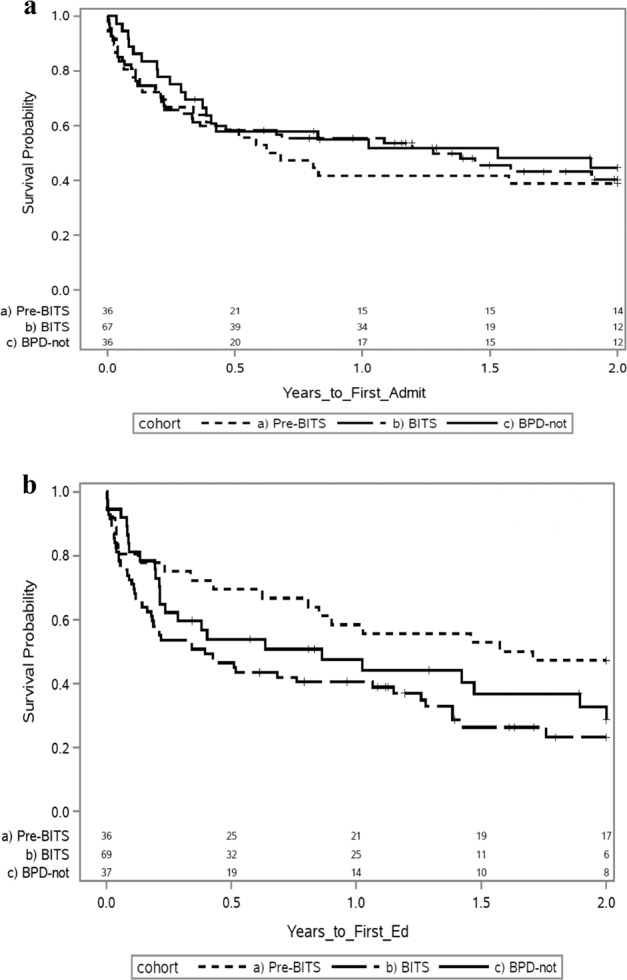
Fig. 1. Kaplan-Meier curves showing the time to first admission and ED visit.

a The percentage and timing of 1st admissions in the first two years of life between Pre-BIT:s, BIT:s and mBPD (61%, 55 and 53% respectively). There was no difference in the percentage or timing of admissions between BIT:s and Pre-BIT:s (p = 0.86). b The percentage and timing of 1st ED visits in the first two years of life between Pre-BIT:s, BIT:s and mBPD (53%, 71 and 65%, respectively). There was a difference in the percentage and timing of ED visits between BIT:s and Pre-BIT:S (p = 0.02).
