Figure 1.
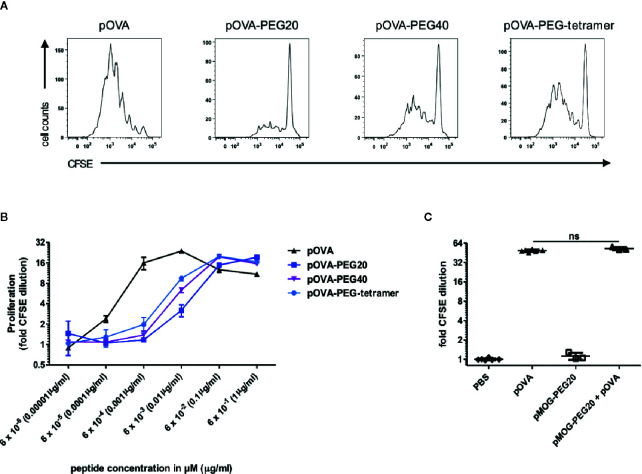
Stimulatory capacity of PEGylated peptides in vitro. (A) Representative histograms of CFSE dilution following stimulation with 6 nM pOVA or equimolar amounts (based on peptide amount) of PEGylated peptides. (B) Dose-response curves of peptide and conjugates. CFSE labeled OVA-specific CD4+ T cells from DO11.10 mice were cultured with irradiated APCs (1:3) for four days. pOVA and equimolar amounts of pOVA-PEG conjugates (based on peptide amount) were added as indicated. For analysis of proliferation, cells were gated on OVA-TCR (KJ1.26)+ CD4+ cells and the geometrical mean of the fluorescence intensity (GMFI) of CFSE was determined. Fold CFSE dilution was calculated as: GMFI (control)/GMFI (sample); log2-scale. One log2 step is equivalent to one cell division. Data are means of triplicates ± SD and representative for at least three independent experiments. (C) To exclude unspecific inhibitory effects of the PEG polymer, OVA-specific CD4+ T cells were stimulated in vitro with 100 nM pOVA in presence or absence of 100 nM of the irrelevant pMOG-PEG20. After 6 days, proliferation was assessed by flow cytometry. n = 3–6 from two independent experiments. Statistical testing was performed using the nonparametric Mann Whitney test and Holm-Bonferroni correction for multiple comparisons. ns, non-significant. For (B), dose response curve fitting and statistical analysis is provided in Supplementary Figure 2 .

