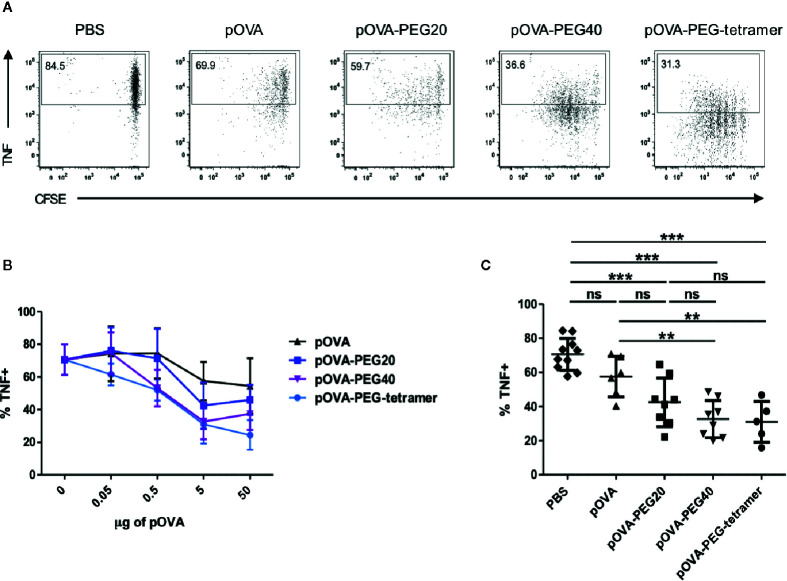
Figure 6.
Reduced frequency of TNF+ among OVA-TCR+ T cells upon treatment with PEGylated pOVA. 24 h after transfer of OVA-specific CFSE-labeled CD4+ T cells, recipients were treated i.v. with PBS (control), pOVA or equimolar amounts of pOVA-PEG conjugates. After 6 days, TNF production was assessed by intracellular staining of restimulated cells. Splenocytes were gated on OVA-TCR+ CD4+ cells. (A) Representative FACS dot plots of TNF expression following tolerization with pOVA or pOVA-PEG conjugates at a dose of 5 µg (based on peptide amount). (B) Dose response curve. Mean ± SD of % TNF+ from at least two independent experiments. n = 4–6; PBS, n = 10. (C) Data for treatment with 5 µg of pOVA or equimolar amounts of PEGylated pOVA. Mean ± SD of % TNF+ cells from at least two independent experiments. Statistical testing was performed using the nonparametric Mann Whitney test and Holm-Bonferroni correction for multiple comparisons. ns, non-significant, **p < 0.01; ***p < 0.001.

