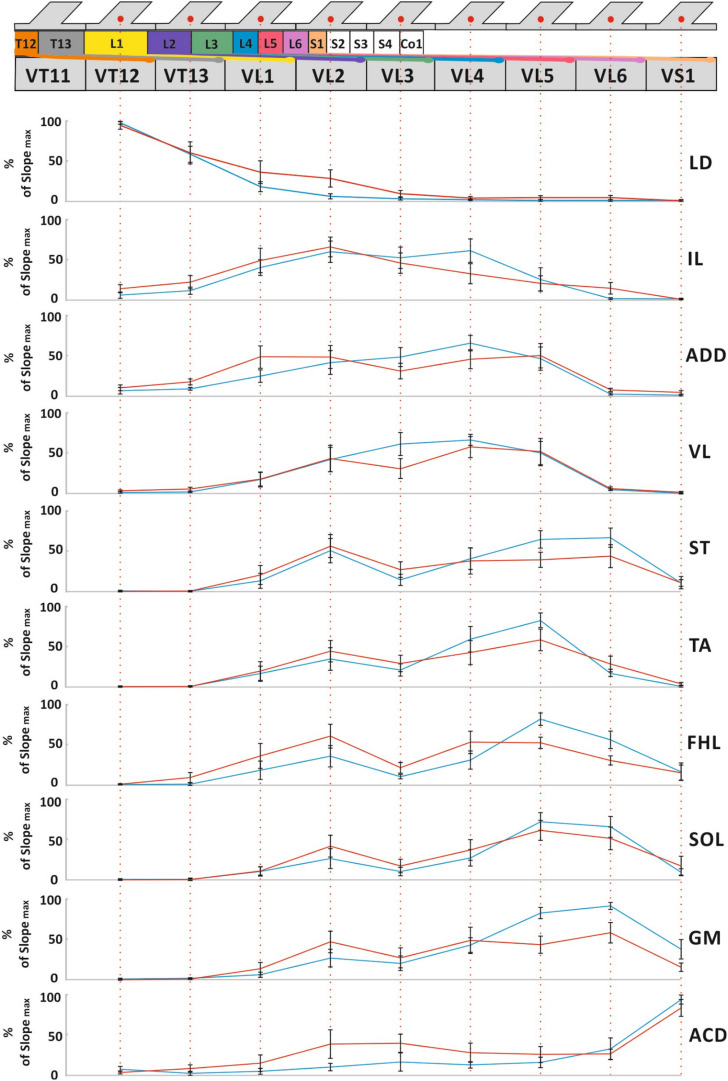
FIGURE 5.
The mean skeletotopy of spinal cord segments in relation to the VT12–VS1 vertebrae (the T11–S1 segments, their roots, and DRGs are marked by different colors corresponding to Figure 2) versus the averaged distributions of normalized slopes for mm. longissimus dorsi (LD), abductor caudae dorsalis (ACD), iliacus (IL), adductor magnus (ADD), vastus lateralis (VL), semitendinosus (ST), tibialis anterior (TA), gastrocnemius medialis (GM), soleus (SOL), and flexor hallucis longus (FHL) at the stimulation of these vertebrae. Motor responses (blue), sensory responses (red). The length of all vertebrae presented are equalized for simplicity.

