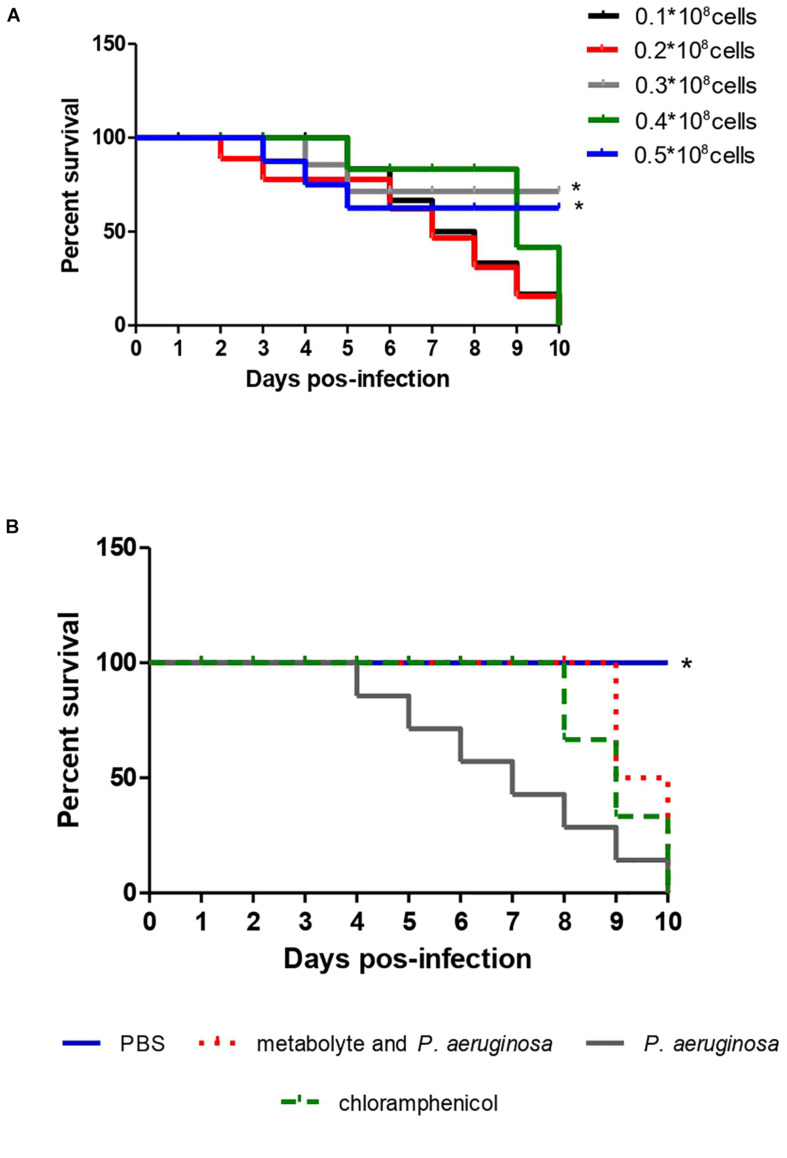
FIGURE 4.
Survival curve of 10 T. molitor larvae infected with different concentrations of P. aeruginosa cells ATCC 0030 for standardization of the inoculum (A) and for treatment with metabolite produced by Streptomyces ansochromogenes (B). All experiments were carried out in triplicate for statistical analysis, p < 0.05 was considered.

