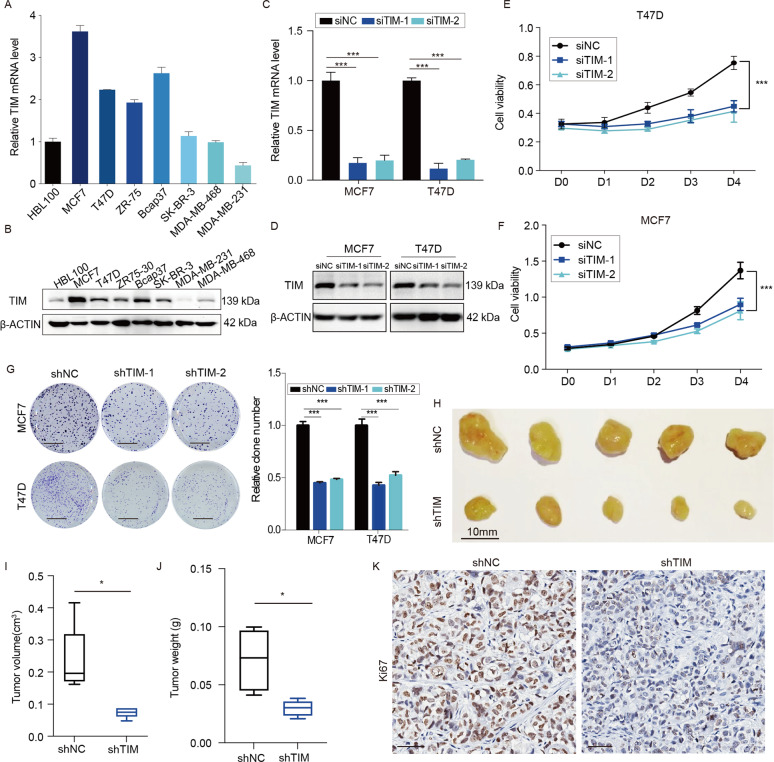
Fig. 2. TIM knockdown inhibits breast cancer cell proliferation.
a, b Relative mRNA and protein expression level of TIM in seven breast cancer cell lines and normal mammary epithelial cell line HBL100. Values are means ± SD. c, d The interference efficiency of TIM via small interfering (siRNA) in MCF7 and T47D cells. Values are means ± SD, ***p < 0.001 (Student’s t-test). e, f Cell viability of MCF7 and T47D cells interfered by siRNA. Values are means ± SD, ***p < 0.001 (Student’s t-test). g Colony formation assay of MCF7 and T47D stably interfered by shRNA. Values are means ± SD, ***p < 0.001 (Student’s t-test). Scale bar is 5 mm. h Orthotopic xenograft transplanted with shNC and shTIM/MCF7 cells (n = 5). Scale bar is 10 mm. i Tumor volume at day 30 was measured in each group. Values are means ± SD, **p < 0.01 (Student’s t-test). j Tumor weight at day 30 was measured in each group. Values are means ± SD, *p < 0.05. k Representative images of Ki67 staining in orthotopic xenograft tissue from shNC and shTIM mice. Scale bar is 50 mm.

