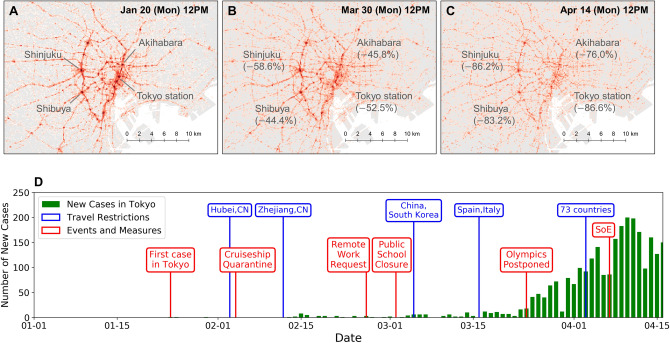
Figure 1.
Macroscopic mobility dynamics. (A–C) show the population distributions on three different dates at same times (12 p.m.), each on the same day of week (Mondays). Substantial decrease in the population density at stations and cities along the Yamanote-line (ring railway) can be observed. (D) shows the timeline of the COVID-19 response and occurrence of new cases in Tokyo. Green bars show the number of cases for each day, blue annotations show inbound travel restrictions, and red annotations list related events and the policy interventions by the Japanese Government.

