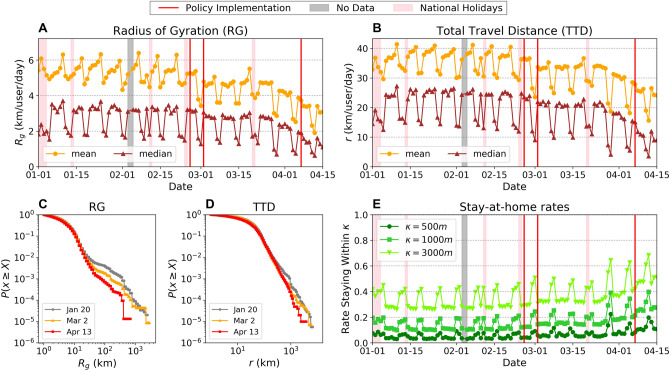
Figure 2.
Changes in individual mobility patterns. Temporal transition of mean and median radius of gyration (A), total travel distance per day (B) and their complementary cumulative distribution functions (C), (D), respectively. Panel (E) shows the rate of staying meters within estimated home locations. Red vertical lines in panels (A, B, E) show the timings of NPIs (remote work request, public school closure, and state of emergency, respectively).

