Figure 2.
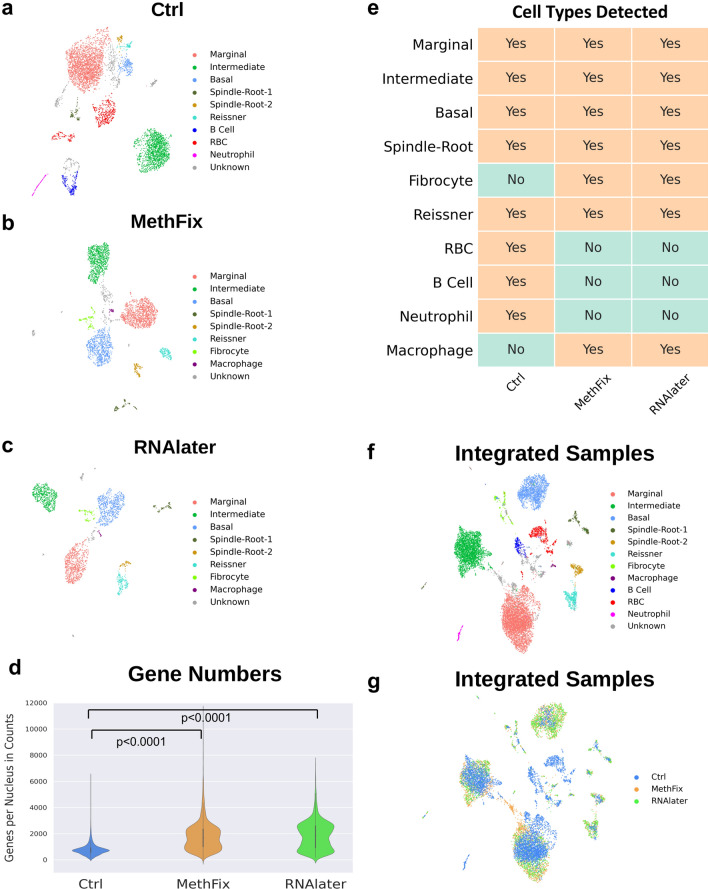
Comparison of Ctrl, MethFix and RNAlater datasets. snRNASeq datasets. (a) Ctrl, (b) MethFix and (c) RNAlater, were clustered by modularity-based clustering method with Leiden optimization algorithm, and visualized by 2D UMAP embedding. (d) Increased number of genes detected per nucleus in sample preservation datasets (1682 median genes per nuclei in MethFix, 1857 median genes per nuclei in RNAlater) compared to Ctrl dataset (727 median genes per nuclei) (one-way ANOVA p < 0.0001), while no significant difference between MethFix and RNAlater dataset (post hoc t-test, p = 0.88). (e) Major SV cell types (marginal, intermediate, basal), spindle-root and Reissners’ membrane cells are detected in all three datasets, but other small populations of cells (fibrocyte,macrophage, RBC, B cell and neutrophil ) are detected in either Ctrl or MethFix/RNAlater datasets. Ctrl, MethFix and RNAlater datasets are integrated by Harmony and visualized by 2D UMAP embedding. Integrated cells are colored based on (f) cell identities or (g) original dataset (Ctrl, MethFix, RNAlater).

