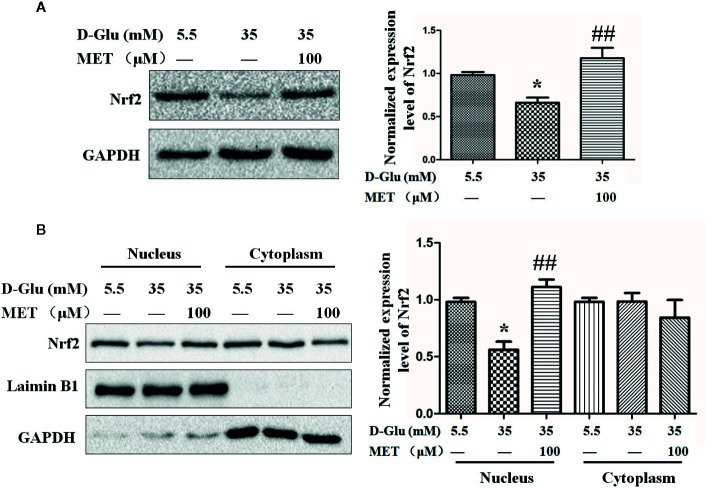
Figure 3.
The upregulation of Nrf2 by metformin (MET). (A) Western blot analysis of the Nrf2 level in HUVECs treated with 5.5 or 35 mM D-Glucose with or without MET (100 μM) for 72 h. The Nrf2 level was quantified and shown on the right. (B) Western blot analysis of the Nrf2 level in nucleus and cytoplasm of HUVECs treated with 5.5 or 35 mM D-Glucose with or without MET (100 μM) for 72 h. The Nrf2 level was quantified and shown on the right. All the values displayed are mean ± SEM of 8 independent experiments. *P < 0.05 vs. 5.5 mM D-Glucose group; ##P < 0.001 vs. 35 mM D-Glucose group.

