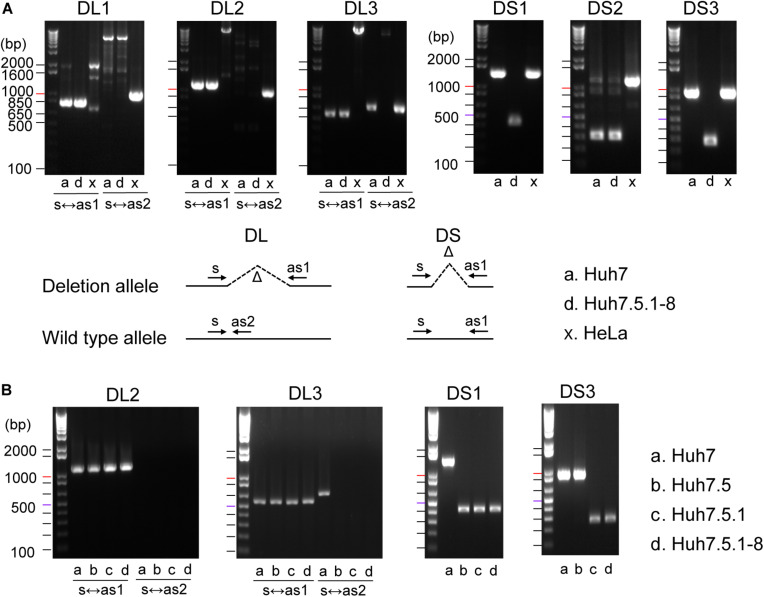
FIGURE 1.
(A) Evaluation of deletions identified in Huh7 and Huh7.5.1-8 using PCR. Samples in lanes a, d, and x are DNA from Huh7, Huh7.5.1-8, and HeLa cells, respectively. Size markers are indicated by horizontal lines. The designs for PCR amplification and expected results are shown on the bottom of panel. The region name is given for each gel image. Prefixes DL and DS represent whether the expected deletion length is long (>7.4 kbp) or short (<0.9 kbp). For DL regions, primer pairs used for the experiments are shown below each image. For DS regions, primer pairs s and as1 were used for all regions. Each gel image was cropped from the full-sized gels, but different lanes were not merged into a single image. (B) Evaluation of deletions in Huh7, Huh7.5, Huh7.5.1, and Huh7.5.1-8 using PCR. Samples in lanes a, b, c, and d are DNA from Huh7, Huh7.5, Huh7.5.1, and Huh7.5.1-8, respectively.

