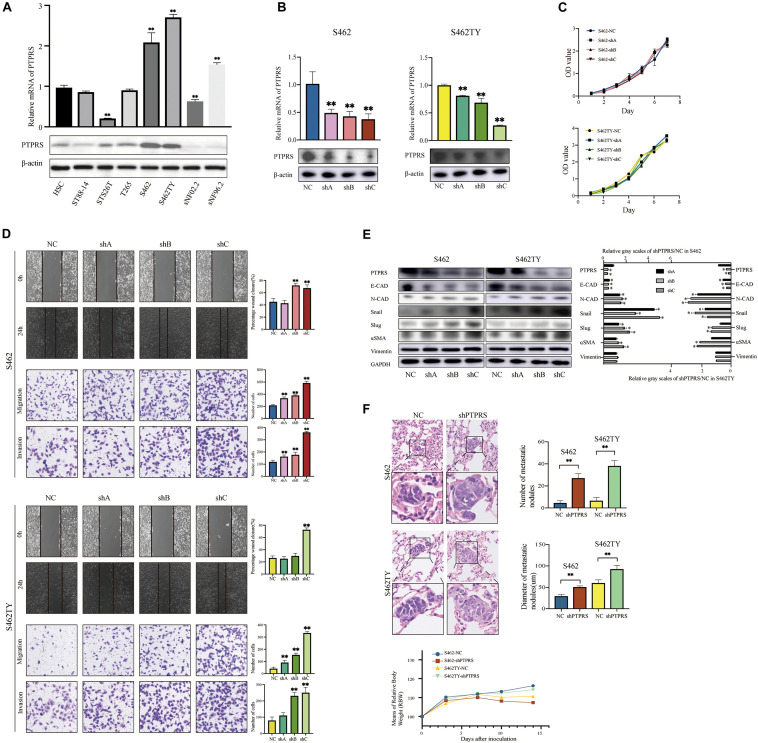
FIGURE 2.
Downregulation of PTPRS mediated MPNST cell migration and invasion in vitro and metastasis in vivo. (A) Relative PTPRS mRNA and protein levels in HSC and MPSNT cell lines. β-Actin was used as a loading control. **p < 0.05. (B) Relative PTPRS mRNA and protein levels in PTPRS knockdown cell lines. The shA, shB, and shC represented three hairpins. β-Actin was used as a loading control. **p < 0.05. (C) Effects of PTPRS knockdown on cell proliferation (p > 0.05). (D) Effects of PTPRS knockdown on cell migration and invasion. Representative images of wound healing assays and migrated or invasive cells were shown (left panels). Results were represented as mean ± SD in triplicate using bar graph (right panels). **p < 0.05. (E) Protein levels of key EMT markers, including E-cadherin, N-cadherin, Snail, Slug, α-SMA, and vimentin were shown in indicated cells (left panels). Relative gray scales of shPTPRS/NC were shown as grouped columns. Results were represented as mean ± SD in triplicate using bar graph (right panels). *p < 0.05. (F) Effects of PTPRS knockdown on tumor metastasis in vivo. Left panel: Representative hematoxylin and eosin images of mice lung tissue sections. Magnifications: ×40; ×100. Right panel: Number and diameter of lung metastatic foci in each group (n = 8) were presented as mean ± SD. **p < 0.05. Bottom panel: Changes of body weights of mice over time (p > 0.05). PTPRS, protein tyrosine phosphatase receptor S; MPNST, malignant peripheral nerve sheath tumor; HSC, human Schwann cell; NC, normal control; E-CAD, E-cadherin; N-CAD, N-cadherin; α-SMA, alpha smooth muscle actin.

