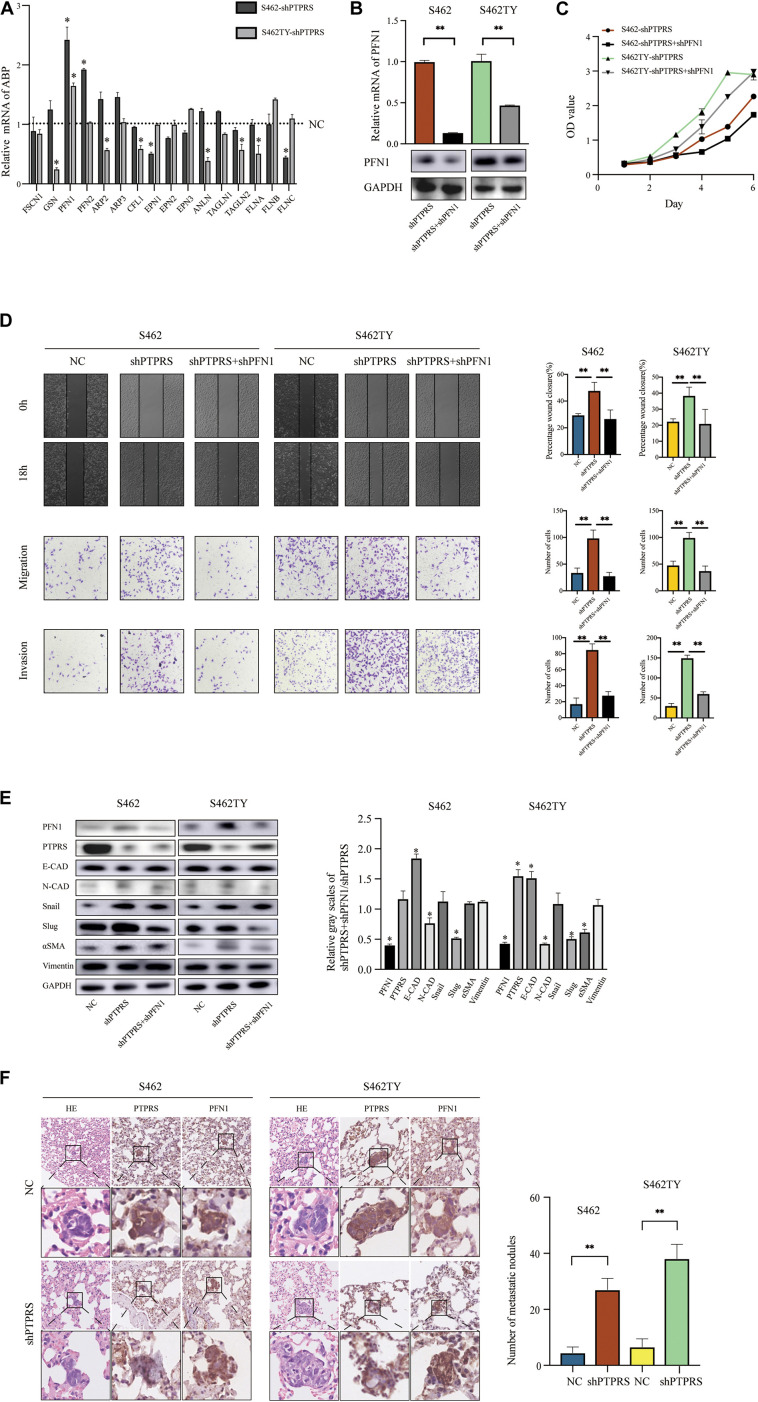
FIGURE 4.
PTPRS mediated MPNST cell migration and invasion via PFN1. (A) Relative mRNA levels of EMT related ABP in two PTPRS knockdown cell lines. GAPDH was used as a loading control. *p < 0.05. (B) Relative PFN1 mRNA and protein levels in PTPRS knockdown and PTPRS + PFN1 dual knockdown cell lines. GAPDH was used as a loading control. **p < 0.05. (C) Effects of PFN1 knockdown on cell proliferation (p > 0.05). (D) Protein levels of key EMT markers, including E-cadherin, N-cadherin, Snail, Slug, α-SMA and vimentin, were shown in indicated cells (left panels). Relative gray scales of shPTPRS + shPFN1/shPTPRS were shown as grouped columns. Results were represented as mean ± SD in triplicate using bar graph (right panels). *p < 0.05. (F) Effects of PTPRS + PFN1 dual knockdown on cell migration and invasion. Representative images of wound healing assays and migrated or invasive cells were shown (left panels). Results were represented as mean ± SD in triplicate using bar graph (right panels). **p < 0.05. (E) Representative immunostaining images of PFN1 and PTPRS in mice lung tissue sections. Number and diameter of lung metastatic foci in each group (n = 8) were presented as mean ± SD. **p < 0.05. PTPRS, protein tyrosine phosphatase receptor S; EMT, epithelial-mesenchymal transition; NC, normal control; FSCN1, fascin actin-bundling protein 1; GSN, gelsolin; PFN1, profilin 1; PFN2, profilin 2; ARP2, actin related protein 2; ARP3, actin related protein 3; CFL1, cofilin 1; EPN1, epsin 1; EPN2, epsin 2; EPN3, epsin 3; ANLN, anillin actin binding protein; TAGLN1, transgelin 1; TAGLN2, transgelin 2; FLNA, filamin A; FLNB, filamin B; FLNC, filamin C; E-CAD, E-cadherin; N-CAD, N-cadherin; α-SMA, alpha smooth muscle actin.

