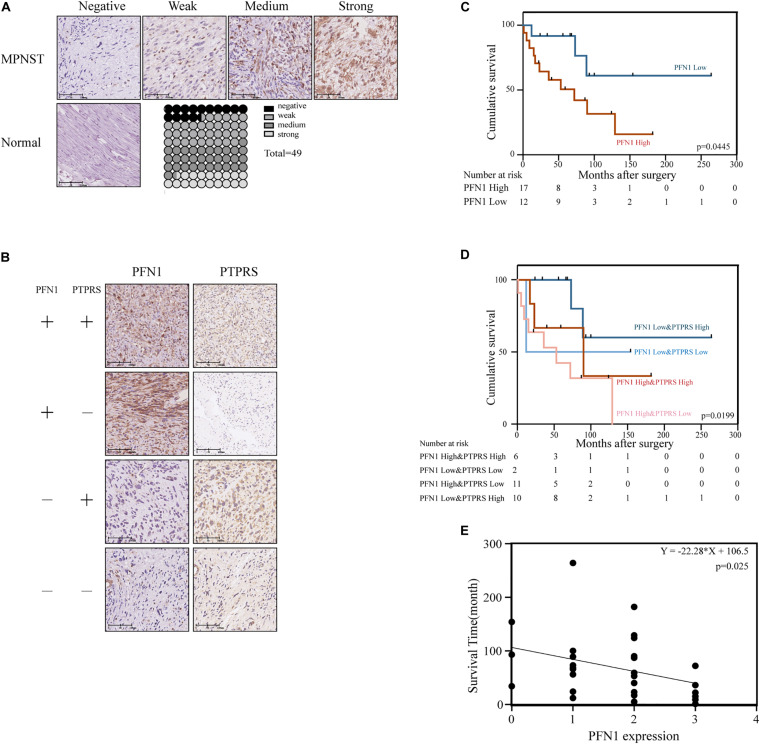
FIGURE 5.
Upregulation of PFN1 correlated with poor prognosis in MPNST patients. (A) Representative immunostaining images of PFN1 negative/weak/medium/strong and normal nerve tissue cases and proportions (%) of different levels of tissue microarray dots. (B) Representative immunostaining images of PFN1 and PTPRS in same patients. The number of patients fall into each group were 14 (PFN1 high and PTPRS high)/11 (PFN1 high and PTPRS low)/20 (PFN1 low and PTPRS high)/4 (PFN1 low and PTPRS low) in the tissue microarray cohort (total = 49), respectively. The “+” represents high expression (score = 2 or 3); the “–” represents low expression (score = 0 or 1). (C) Kaplan–Meier’s curves for cumulative survival according to PFN1 level in MPNST cohort with available follow-up data (n = 29, p = 0.0445). (D) Kaplan–Meier’s curves for cumulative survival according to PFN1&PTPRS level in MPNST cohort with available follow-up data (n = 29, p = 0.0199). (E) Correlation between expression of PFN1 level in tissues of dead patients and survival time after surgery (p = 0.0025). PTPRS, protein tyrosine phosphatase receptor S; PFN1, profilin 1; MPNST, malignant peripheral nerve sheath tumor.

