Figure 5.

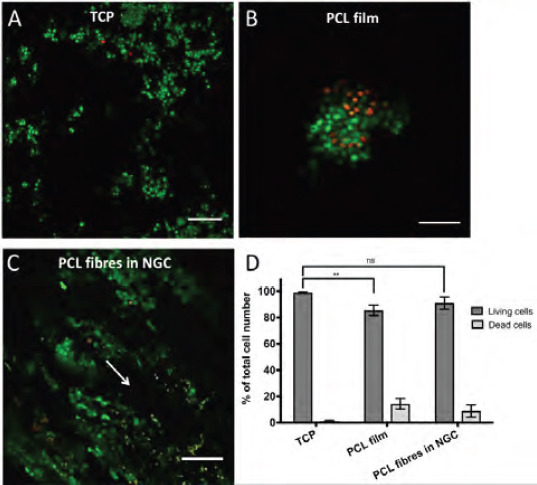
Overview of live and dead neuronal cells in the proposed 3D model. NG108–15 neuronal cells were cultured on TCP (A), PCL films (B) and on PCL microfibres inside the NGC test device (C) for 4 days. Live cells were identified with Syto 9 (green) and dead cells with propidium iodide (red). Cell imaging on fibres was conducted in the centre of the scaffold in z-stacks (depth 400 μm) and was illustrated as maximum intensity images. Arrow indicates the fibre orientation in NGCs. (D) shows the percentile distribution of living (dark bars) and dead cells (light bars) in the three different conditions (A–C). Living cells on TCP accounted 98.9 ± 0.6 %, on PCL films 85.6 ± 3.9 % and 91 ± 4.6 % on microfibres in NGCs in relation to the total cell population. No significant (ns) differences between data points of living cells on TCP and microfibres inside NGCs could be found, where significance was seen between TCP and PCL films. Data points of living cells were analysed by one-way ANOVA (**p < 0.01). Scale bar = 150 μm.”
