
Figure 4.
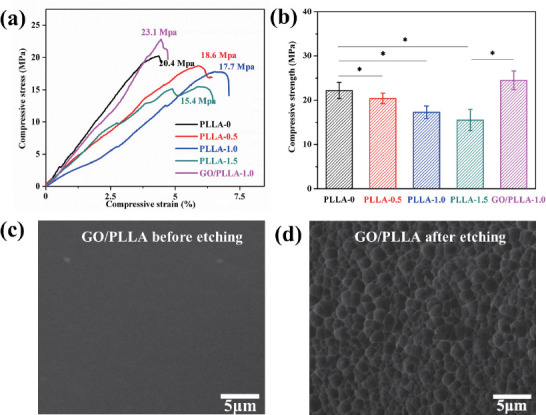
(a) Representative stress-strain curves and (b) compressive strength of the scaffolds under compression tests. Asterisks denote significant difference with p < 0.05, as compared with PLLA-0 scaffold. n = 5. The typical surface microstructure of (c) GO/PLLA scaffold and (d) GO/PLLA-1.0 scaffold.