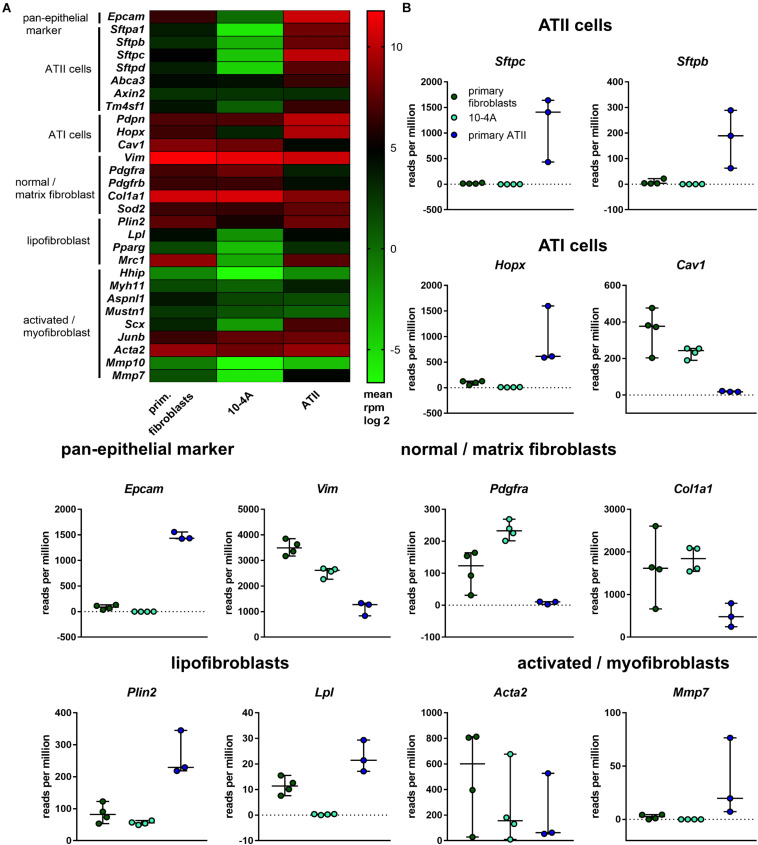
FIGURE 2.
Transcriptomic profile of 10-4A compared to freshly isolated rat fibroblasts and ATII cells. (A) Heat map of selected pan-epithelial, ATII, ATI and different fibroblast subtype marker genes. Values are given as log2-fold change of the mean reads per million base pairs. 10-4A and primary fibroblasts, N = 4, primary ATII cells, N = 3. (B) Detailed presentation of rpm values obtained for selected marker genes.

