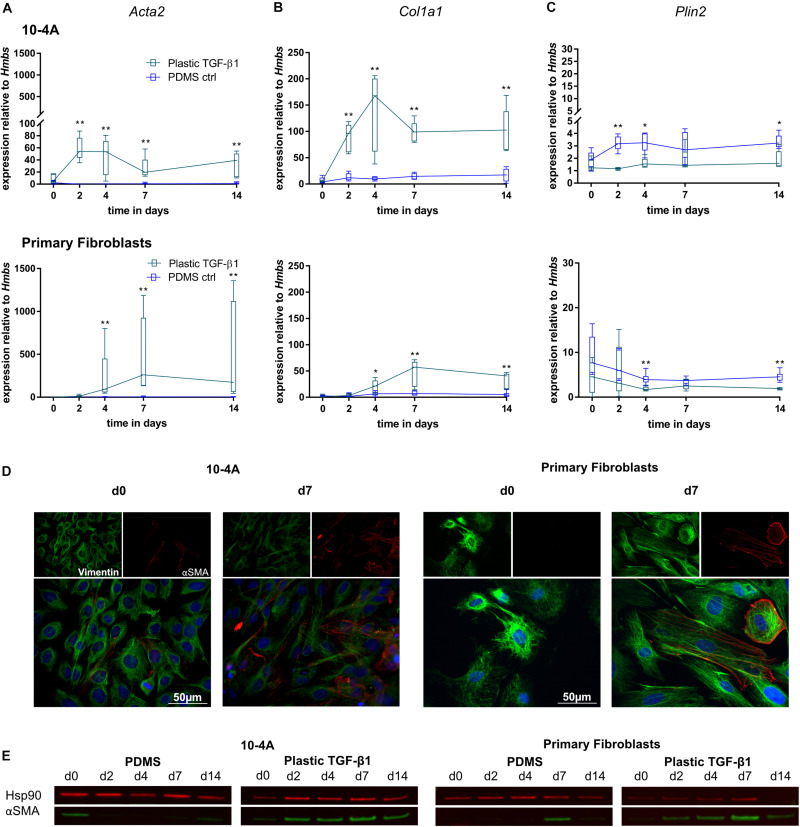
FIGURE 5.
Combination of chemical and mechanical stimulation of 10-4A cells and primary fibroblasts with TGF-β1 on a physiological substrate. Semi-quantitative RT-PCR of Acta2 (A), Col1a1 (B), and Plin2 (C) expression in 10-4A cells (top graph) and primary fibroblasts (bottom graph) cultured on either soft substrate (PDMS) or in the presence of 5 ng/ml TGF-β1 stiff substrate (Plastic), respectively. Data are expressed as fold expression of housekeeping gene Hmbs. Primary fibroblast data were obtained from five different animals, 10-4A data from five independent cell culture experiments. The respective time points were tested with the non-parametric Mann–Whitney-U-Test. Statistical significance is indicated as follows: p-values < 0.05: *, p-values < 0.01: **. Box plots show data as median values, the boxes represent percentiles, the whiskers indicate the minimum/maximum. (D) Immunofluorescence staining of 10-4A cells (left) or primary fibroblasts seeded on PDMS with administration of 5 ng/ml TGF-β1 directly after adherence (d0) or 7 days post-seeding. Cells were stained for the mesenchymal marker Vimentin (green) and the pro-fibrotic protein αSMA (red). Scale bar = 50 μm. (E) Western Blot for αSMA in 10-4A cells and primary fibroblasts cultured over 14 days on PDMS substrate or on Plastic in the presence of TGF-β1, respectively. HSP90 was used as loading control.

