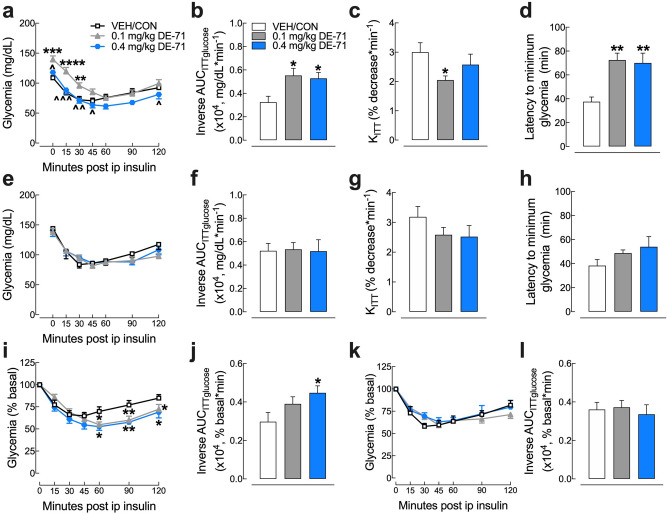
Figure 5.
DE-71 exposure causes less glycemia reduction and delayed glucose clearance after insulin challenge in F1 but not F0 female mice. Absolute blood glucose concentrations were recorded before and at t = 15, 30, 45, 60, 90 and 120 min post-injection with 0.5 U/kg insulin for female offspring (F1) (a) and their mothers (F0) (e). Glycemia was analyzed by inverse integrated area under the ITT glucose curve (AUCITTglucose) for F1 (b) and F0 (f). Rate constant for glucose reduction (KITT) was calculated over the initial slope of ITT glucose response curve from 0–15 min post-injection and was significantly reduced for F1 at 0.1 mg.kg (c) but not for F0 (g). Latency to minimum blood glucose measured over the two hour time course of ITT glucose response curve for F1 (d) and F0 (h). Glucose values taken during ITT are plotted versus time as a percent of the individual baseline for F1 (i) and F0 (k). The inverse integrated area (AUC) under the percent basal glucose curve (AUCITTglucose) shows a significant increase commensurate with a prolonged insulin response for F1 (j) but not F0 (l). *Indicates significantly different from VEH/CON (*P < .05; **P < .01, ***P < .001, ****P < .0001). ^Indicates significantly different from 0.1 mg/kg DE-71 (^P < 0.05, ^^P < .01, ^^^P < .001). Glycemia at all time points differs from baseline for corresponding group. Dunnett’s and Tukey’s post-hoc tests were used. All values represent mean ± s.e.m. n = 8–12/group. F1 female offspring, F0 dams.

