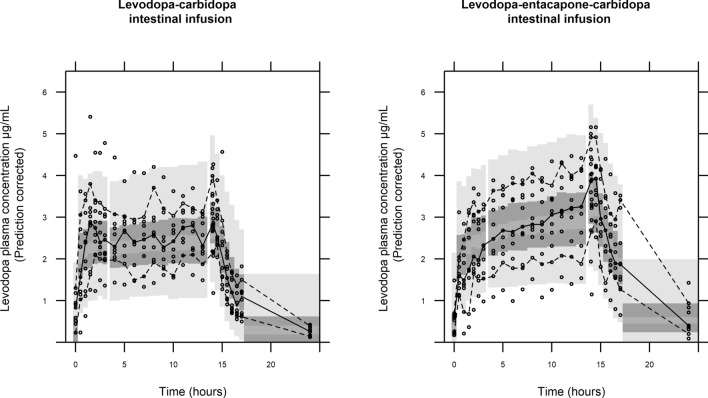
Figure 1.
Prediction corrected visual predictive check (1000 samples) of the concentration–time data for LCIG and LECIG. The solid line is the median of the observed data. The dashed lines represent the observed 10th and 90th percentiles of the observations. The top and bottom light grey areas are the 95% confidence intervals for 10th and 90th percentiles of the simulated data. The middle dark grey area is the 95% confidence interval for the median of the simulated data.

