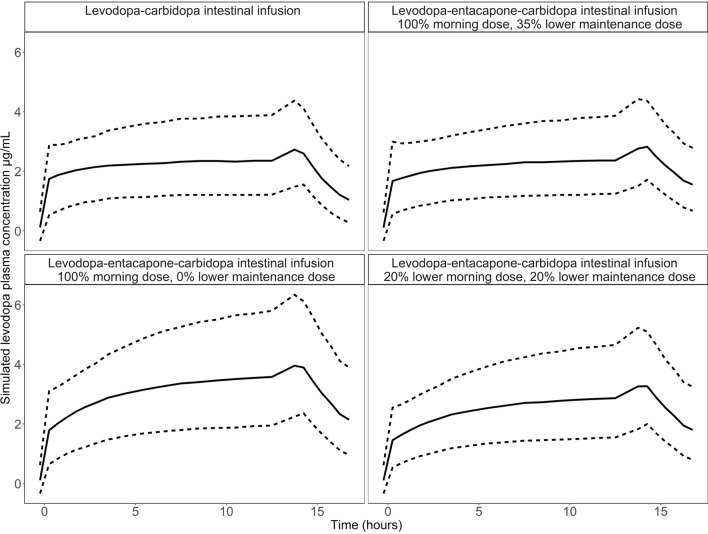
Figure 2.
Simulated plasma concentration for the study population, with unchanged patient doses of LCIG as reference (top left plot) and decreased continuous doses for LECIG treatment by: 0% lower morning dose and 35% lower maintenance dose (top right plot), 0% lower morning and maintenance dose (bottom left plot) and 20% lower morning and maintenance dose (bottom right plot). The solid line represents the median of the simulated data, the top and bottom dashed lines represent the 10th and 90th percentiles of the simulated data.

