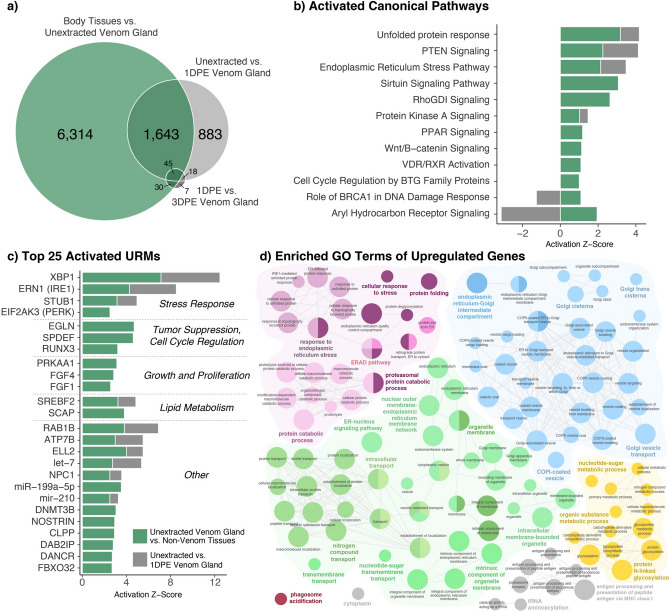
Figure 3.
Functional characterization of gene expression in the venom gland relative to other non-venom secretory tissues. (a) Venn diagram denoting shared and unique genes between all pairwise comparisons. (b) Inferences of activated canonical pathways based on differentially expressed genes between non-venom tissues and the unextracted venom gland (green), with inferred activity in analyses of unextracted versus 1DPE venom gland tissues shown in grey if present. (c) Top 25 inferences of activated URMs based on differentially expressed genes between non-venom tissues and the unextracted venom gland (green), with inferred activity in analyses of unextracted versus 1DPE venom gland tissues shown in grey if present. (d) Significantly enriched GO terms of genes significantly upregulated in the unextracted venom gland relative to body tissues. All terms shown are significantly enriched (p < 0.05), and node size is inversely proportional to enrichment p-value, with larger nodes having a lower p-value. Connected nodes indicate a high proportion of shared genes underlying term enrichment.

