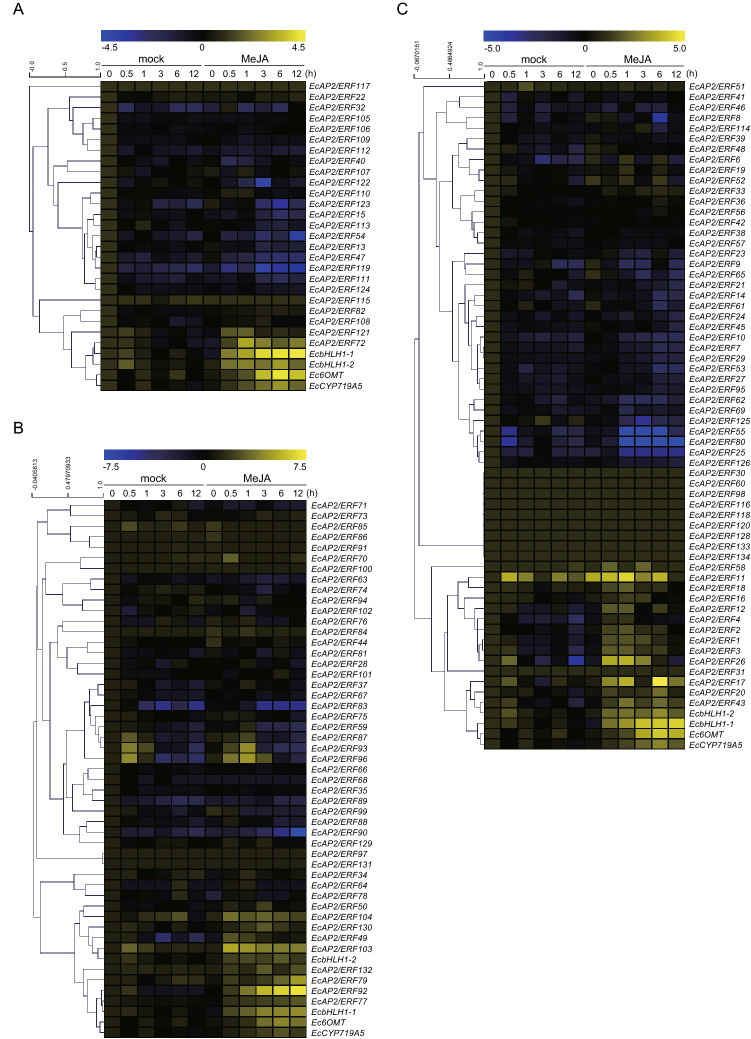
Figure 6.
Expression profiles of EcAP2/ERF genes after MeJA treatment using RNA-seq data. Heat maps showing the clustering of AP2 and RAV family EcAP2/ERF genes (A), DREB subfamily EcAP2/ERF genes (B) and ERF subfamily EcAP2/ERF genes (C) with EcbHLH1-1, EcbHLH1-2, Ec6OMT and EcCYP719A5 were created with log2-based FPKM values using MeV software. Within each row, the blue and yellow colours correspond to low and high values, respectively. The scale represents the signal intensity of the FPKM values.

