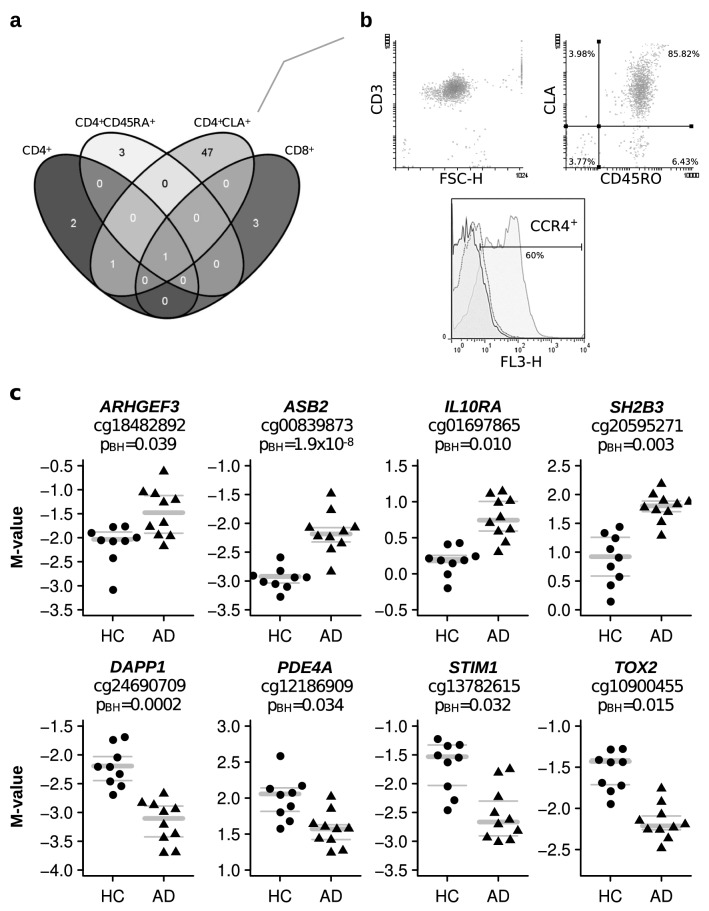
Figure 1.
Differentially methylated probes (DMPs) in peripheral blood T cells between AD patients and HC. (a) Venn diagram showing the overlap of DMPs in four different sorted T cell populations. Plotted with the open webtool venny 2.0 (https://bioinfogp.cnb.csic.es/tools/venny/). (b) Representative flow cytometry analysis of CD3, CLA, CD45RO and CCR4 in sorted CD4+CLA+ T cells. Numbers within quadrants represent percentage of cells. FSC-H: forward scatter height; in histogram solid black line: unstained; dotted line: isotype control; gray line: anti CCR4 staining. (c) Eight DMPs in CD4+CLA+ T cells. DNA methylation levels are expressed as M-values, gray bars indicate mean (bold), upper and lower (thin) quartiles. M values above 1 represent that the CpG site is methylated, and M values below − 1 represent that the CpG site is demethylated. Each dot represents an individual, HC (n = 9) and AD patients (n = 10). PBH = Benjamini Hochberg p value.

