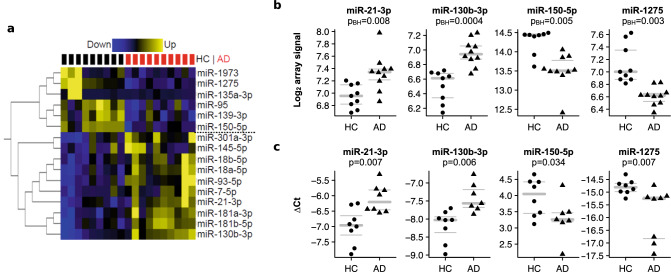
Figure 3.
Differentially expressed miRNAs in CD4+CLA+ T cells between AD patients and HC. (a) Differential miRNA expression by miRNA microarray between HC (n = 9) and AD patients (n = 10). Fold expression of 16 miRNAs with significant differences between AD patients and HC (Benjamini Hochberg corrected p value < 0.05). Blue indicates downregulation and yellow indicates upregulation. Each row corresponds to a miRNA and each column to 1 sample. Black and red squares on the top indicate HC and AD samples, respectively. Six down-regulated and 10 up-regulated and miRNAs in AD patients are indicated to the right of the heatmap. Software used Glucore Omics Explorer (https://www.qlucore.com/). (b) Log2 miRNA levels from the microarray analysis between HC and AD patients. The array level indicates the amount of miRNA based on the fluorescence signal in the Cy3 channel. PBH = Benjamini Hochberg p value. (c) ∆-Ct miRNA levels confirmed with qPCR between HC and AD patients. Gray bars in the panels B and C indicate mean (bold), upper and lower quartiles; each dot represents an individual.

