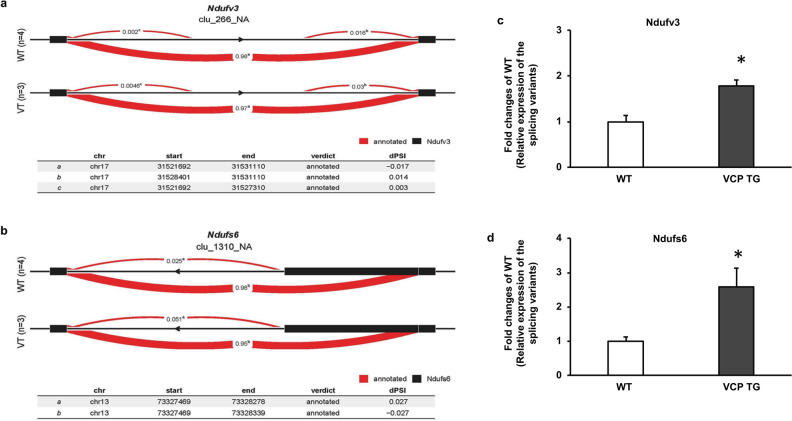
Figure 5.
VCP involves in the alternative splicing of mitochondrial proteins under the stress. (a), (b) Representative LeafCutter cluster plots of the alternative splicing generated by LeafViz for the Ndufv3 (a) and Ndufs6 (b) in VCP TG vs WT at 2W TAC based on FDR < 0.05. Differential splicing was measured by the change in percent spliced in (dPSI). These two DETXs showed differential usage of a mutually exclusive exon between VCP TG and WT groups. (c), (d) Representative qRT-PCR results show the relative expression of splice isoforms by using two pairs of primers *: p < 0.05, n = 4/group.

