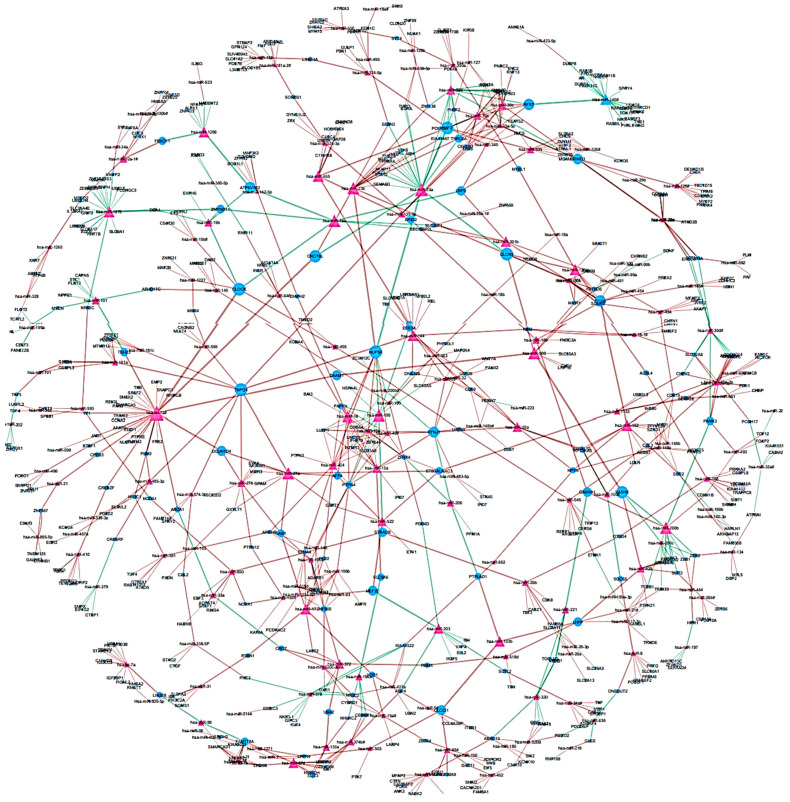
Figure 3.
An Overview of the miRNA–target gene differential regulatory network (MGDRN); the purple triangular and blue circular nodes represent miRNAs and target genes, respectively. The size of nodes represents the degrees of nodes in the network. The brown and green edges in the MGDRN represent downregulation and upregulation involving liver disease versus normal conditions, respectively.

