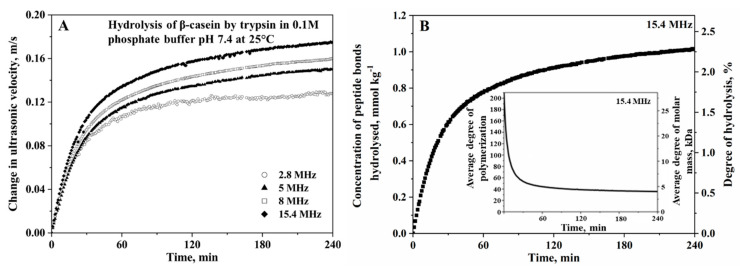
Figure 9.
(A) Ultrasonic velocity profiles of the hydrolysis of β-casein treated with trypsin in 0.1-M phosphate buffer, pH 7, at 25 °C, measured at four different frequencies. (B) The corresponding hydrolytic profiles translated from ultrasonic velocity profiles in Figure 9A using (= 0.115 kg mol−1) determined from ultrasonic calibration with the trinitrobenzene sulfonic acid (TNBS) assay method. The concentration of the peptide bonds hydrolyzed (primary y-axis) is calculated using Equation (9), and the corresponding degree of hydrolysis (secondary y-axis) is calculated using the second Equation (13). The insert presents the reduction of the average degree of polymerization (primary y-axis) and average molar mass (secondary y-axis) calculated from the concentration of the peptide bonds hydrolyzed using Equation (14). The protein concentration is 5 mg mL−1, and the concentration of enzymes is 0.41 µM. Reproduced with permission of Elsevier from Melikishvili et al. [104].

