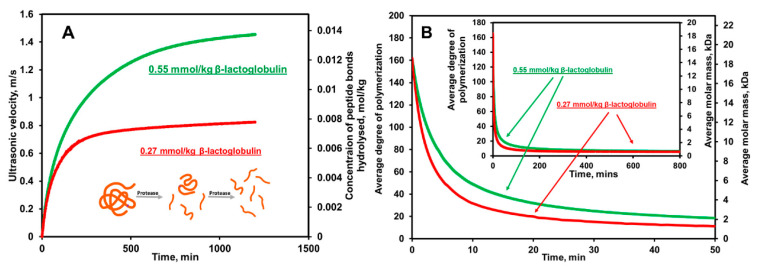
Figure 10.
(A) Ultrasonic velocity profiles of the hydrolysis of β-lactoglobulin treated with α-chymotrypsin in 0.1-M phosphate buffer, pH 7.8, at 25 °C. The concentration of the peptide bonds hydrolyzed (secondary y-axis) was translated from the ultrasonic velocity profile (primary y-axis) using Equation (9) and = 0.07 ± 0.0015 kg mol−1. (B) The corresponding profile of the reduction of the average degree of polymerization (primary y-axis) and average molar mass (secondary y-axis), within 50 min of hydrolysis, calculated from the concentration of the peptide bonds hydrolyzed using Equation (14). The insert illustrates the profile at the full time range of the measurement. The concentration of enzyme is 4 µM. Adopted from Buckin and Altas [73].

